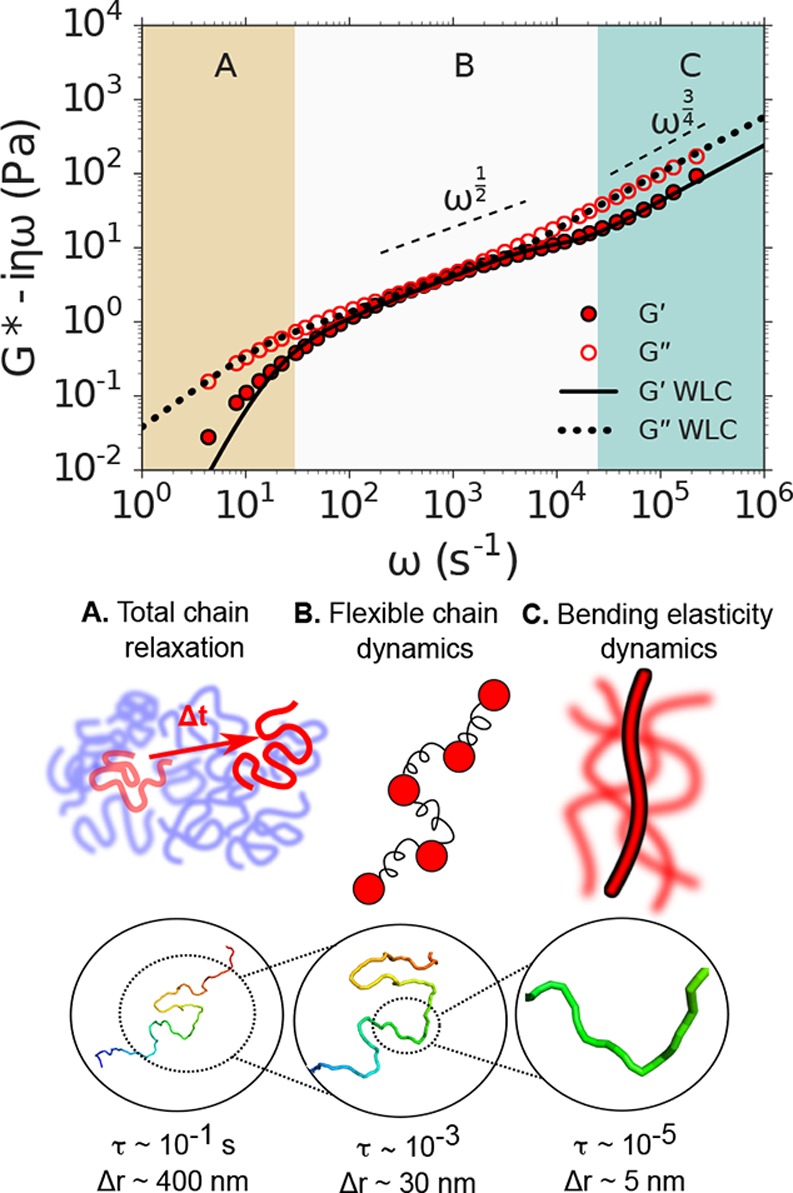
Figure 4.

DLSμR of DNA solutions reveals a hierarchy of molecular relaxations. Top: Shear modulus G* as a function of angular frequency ω of semidilute DNA solutions. Regions A, B, and C represent approximate regimes in which the viscoelastic response is expected to probe the total chain relaxation, internal flexible chain relaxation, and bend relaxation, respectively. Dashed lines indicate the expected scaling laws for a Rouse polymer (G* ∼ ω1/2) and a freely draining semiflexible chain (G* ∼ ω3/4) . The dotted and solid lines indicate the theoretical predictions for G′ and G″, respectively, of a semiflexible polymer modeled as a WLC. Middle: Illustrations of the physical behavior probed at the time-scale regimes annotated A, B, and C in the top plot. Bottom: Representative snapshot of a 5.8 kilobase DNA molecule modeled as a WLC obtained by Monte Carlo simulation. Magnifications represent the approximate contour length of the DNA molecule whose relaxations dominate the viscoelastic response that is probed at time scales τ (which reside within regimes A, B, and C) by tracer particles undergoing approximate displacements Δr.
