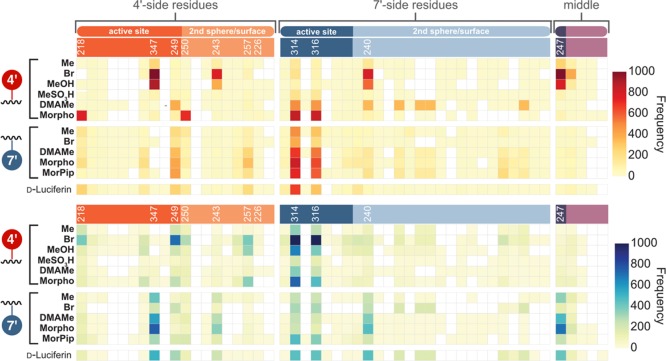
Figure 5.
Orthogonal pair analysis. Heat map of mutation frequency (at a given residue) for enzymes positively paired (top) or negatively paired (bottom) with luciferin analogues. For each plot, the top 5000 pairs from in silico analyses were examined. Enzyme residues are organized by their relative proximity to C4′ or C7′ of luciferin (as in Figure 1b).

