Figure 2.

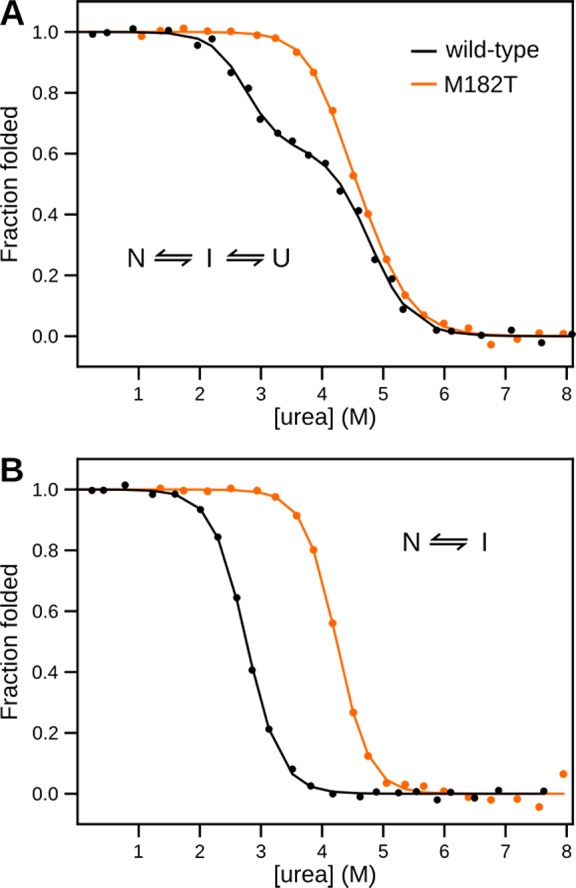
Chemical melts of TEM. Shown are the fractions of folded protein for wild-type TEM (black) and TEM M182T (orange) as a function of [urea]. (A) Monitoring circular dichroism signal. (B) Monitoring intrinsic fluorescence at 340 nm.

Chemical melts of TEM. Shown are the fractions of folded protein for wild-type TEM (black) and TEM M182T (orange) as a function of [urea]. (A) Monitoring circular dichroism signal. (B) Monitoring intrinsic fluorescence at 340 nm.