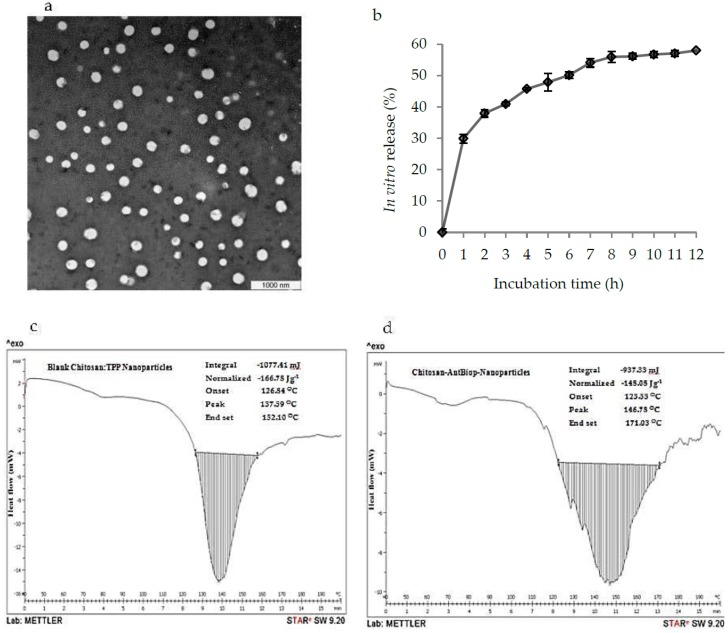
Figure 3.
Physical appearance, in vitro release profiles and differential scanning calorimetry (DSC) of the Chit-AntBiop-NPs; (a) transmission electron microscopy (TEM) images of Chit-AntBiop-NPs, (b) In vitro release profiles of AntBiop from Chit-AntBiop-NPs in PBS pH 7.4 (c) DSC curve of the blank chitosan nanoparticles and (d) DSC curve of the Chit-AntBiop-NPs.

