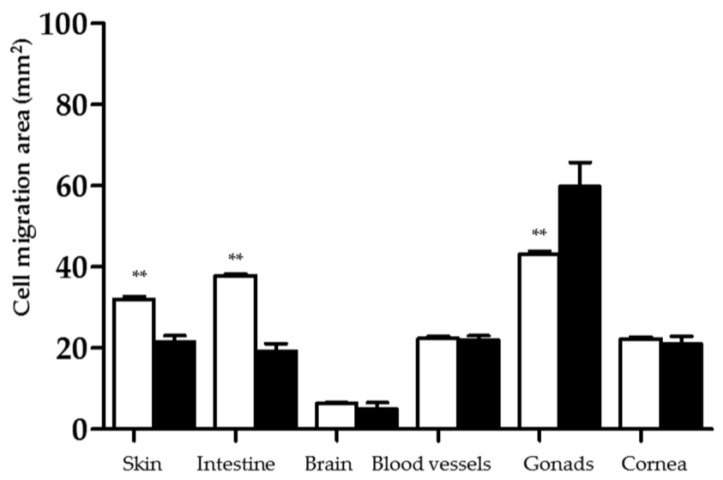
Figure 4.
Cell migration assessment (mm2) on PEO(5%)coHSAm(5%)fb(0.5%) IPNs (white) and Thermanox® (black) after a week of culture. The surface of cell layers surrounding the explants was determined using ImageJ software on neutral red-stained sample pictures taken with a stereomicroscope fitted with a camera. Data were analyzed using Student’s t-test, ** p ≤ 0.001 compared to the Thermanox® group.

