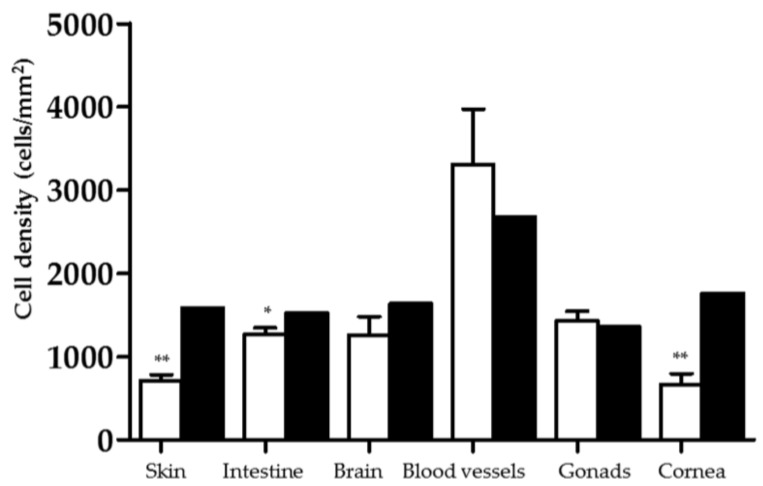
Figure 5.
Cell density (cells/mm2) on PEO(5%)coHSAm(5%)fb(0.5%) IPNs (white) and Thermanox® (black) after a week of culture. This parameter was calculated after enzymatic dissociation using a trypsin-EDTA in Isoton II electrolyte solution at different time points (5, 10, 20, 30, 60 and 75 min) in physiological conditions (37 °C, 5% CO2, 90% humidity). * and ** indicate a significant difference (p ≤ 0.05 and p ≤ 0.001, respectively) compared to the Thermanox® control (Student’s t-test).

