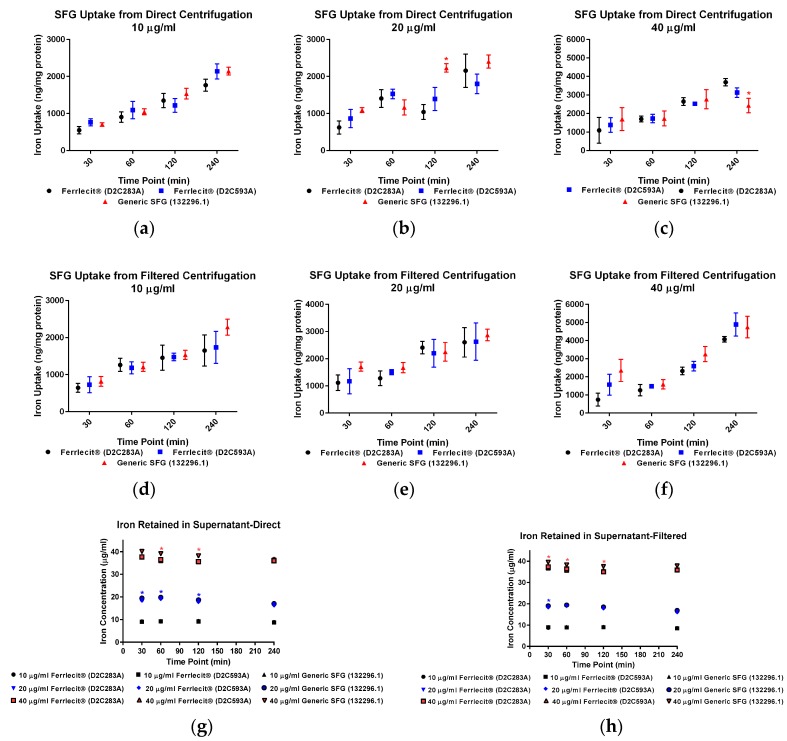
Figure 1.
Comparison of iron uptake in THP-1 cells. Data are presented as mean ± SD (n = 3, three independent experiments with four replicates for each experimental condition). A p-value < 0.05 was considered statistically significant, marked with *. (a) Iron uptake in THP-1 cells treated with 10 µg/mL drugs was measured from direct centrifugation harvest; (b) iron uptake in THP-1 cells treated with 20 µg/mL drugs was measured from direct centrifugation harvest; (c) iron uptake in THP-1 cells treated with 40 µg/mL drugs was measured from direct centrifugation harvest; (d) iron uptake in THP-1 cells treated with 10 µg/mL drugs was measured from filtered centrifugation harvest; (e) iron uptake in THP-1 cells treated with 20 µg/mL drugs was measured from filtered centrifugation harvest; (f) iron uptake in THP-1 cells treated with 40 µg/mL drugs was measured from filtered centrifugation harvest; (g) iron retained in cell culture supernatant was measured from direct centrifugation harvest; (h) iron retained in cell culture supernatant was measured from filtered centrifugation harvest.

