
Figure 2.
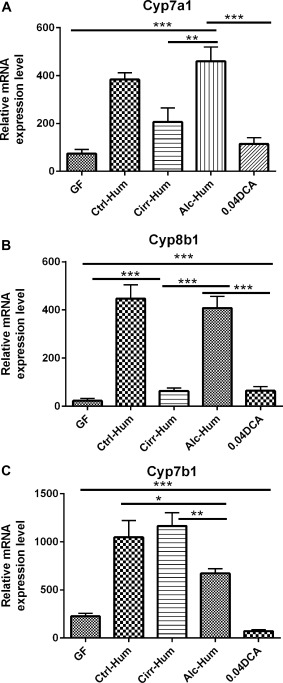
Cholesterol 7α‐hydroxylase (CYP) expression in the liver (relative mRNA expression level). *P < 0.05, **P < 0.01, ***P < 0.001 using the Kruskall‐Wallis test or unpaired t test based on the number of samples compared. All values are in mean ± SEM. (A,B) Cyp7a1 and Cyp8b1 expression was highest in the Alc‐Hum and Ctrl‐Hum groups compared to GF, DCA, and Cirr‐Hum mice. DCA supplementation resulted in appropriate feedback inhibition of Cyp7a1 and Cyp8b1. (C) The alternative pathway enzyme expression Cyp7bB1 was highest in the Cirr‐Hum and Ctrl‐Hum groups but was suppressed in Alc‐Hum, DCA, and GF mice.