
Figure 3.
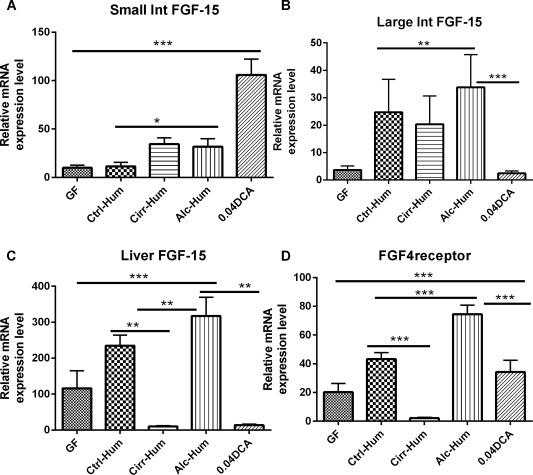
FGF‐15 and FGFR4 expression (relative mRNA expression level). *P < 0.05, **P < 0.01, ***P < 0.001 using the Kruskall‐Wallis test or unpaired t test based on the number of samples compared. All values are in mean ± SEM. (A) Small intestinal FGF‐15 expression was highest in the DCA group. Within the humanized group, this was lowest in the Ctrl‐Hum mice compared to the Alc‐Hum and Cirr‐Hum mice. (B) Large intestinal FGF‐15 expression was high in all three humanized groups but lowest in the Cirr‐Hum group. DCA expression of FGF‐15 was comparable to the GF group. (C) Hepatic FGF‐15 expression was highest in the Alc‐Hum group followed by the Ctrl‐Hum groups. This was lowest in the Cirr‐Hum and DCA groups. (D) FGFR4 receptor expression followed the hepatic FGF‐15 expression patterns. Abbreviation: Int, intestine.