Fig. 2.

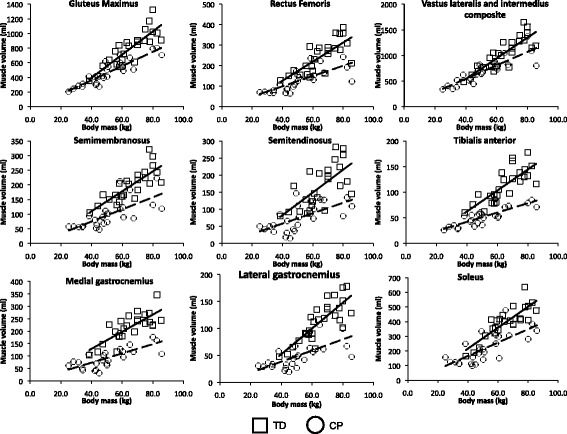
Muscle volume against body mass in the TD group (square, solid line) and group with CP (circle, dashed line) for all muscle investigated. The linear regression coefficient and gradients of the lines of best-fit are given in Table 2

Muscle volume against body mass in the TD group (square, solid line) and group with CP (circle, dashed line) for all muscle investigated. The linear regression coefficient and gradients of the lines of best-fit are given in Table 2