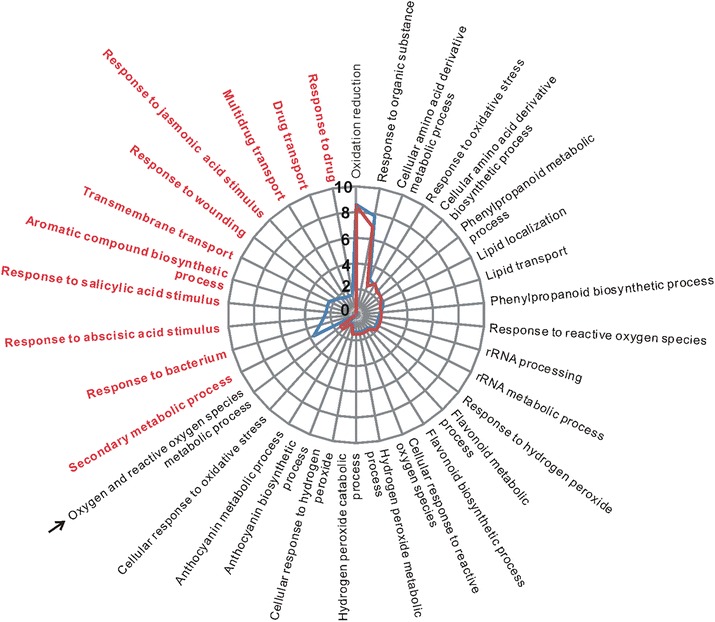
Fig. 2.

GO classification of pLPS-responsive up-regulated genes. BP GO terms obtained from the GO analysis of 605 pLPS-induced up-regulated genes in WT are shown with the blue line. The same analysis conducted with 540 genes, which excluded 65 AtLBR-2-dependent up-regulated genes from the 605 genes, are shown with the red line. The red font highlights no enriched GO terms in the 540 genes. An arrow indicates the GO term identified only in 540 genes. Scale of y axis shows the percentage of genes that are annotated for each biological process. P < 0.01
