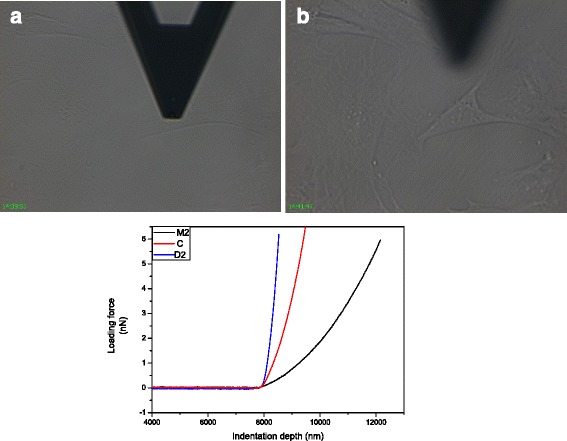
Fig. 2.

AFM Test for TM cells. One single TM cell was under indentation perpendicular to the nuclei surface (a) and after indentation (b). We obtained Force curve for each cell and showed three represented curves (below). Three curves represent cells in D2, M2, and C after translation the contact point at 8000 nm, the blue, dark and red line represents the D2, M2, and the control samples, respectively
