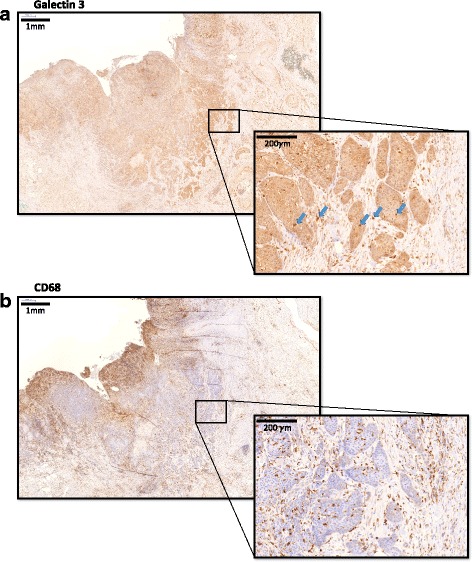
Fig. 1.

Typical expression pattern of Galectin 3 and CD68 in a tumor resection specimen. The figure shows the typical expression pattern of Galectin 3 positive cells (a) and CD68 positive cells (b) in an oscc tumor resection specimen. A panoramic view (2.5× magnification) is given on the left side and a magnification of the indicated region (25× magnification) is displayed on the right side. The epithelial carcinoma cells show a weak expression of Gal3. The Gal3 highly positive cells in the epithelial compartment and the stromal compartment were counted for statistical assessment. Five Gal3 highly positive cells are exemplarily marked with an arrow
