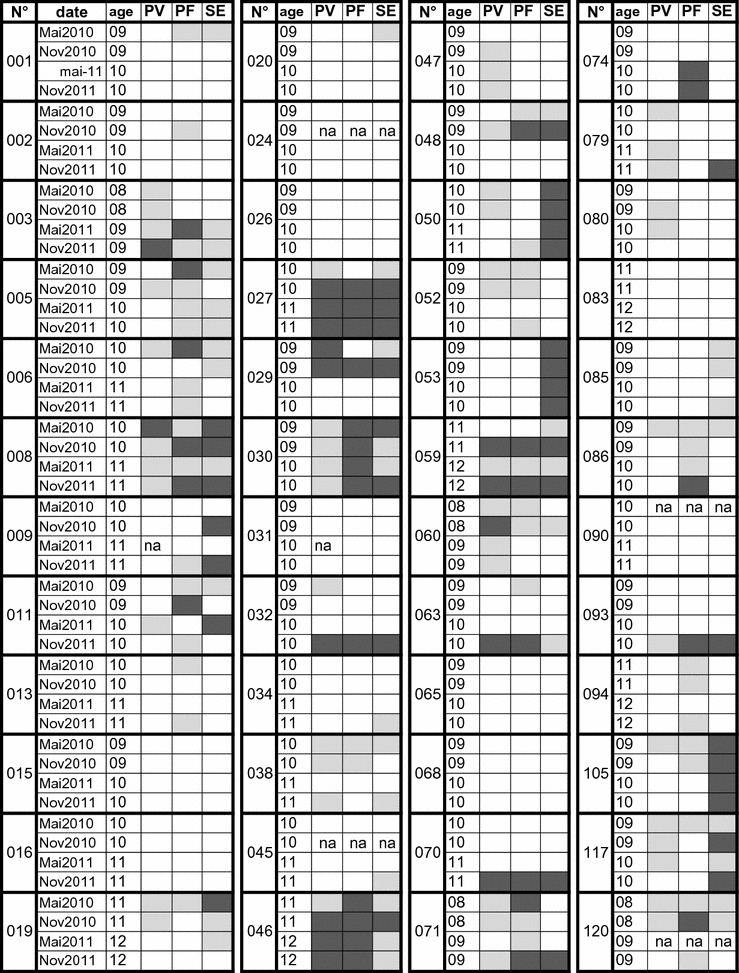
Fig. 1.

Detailed schematic results of individual responses of children to PvMSP1, PfMSP1p19 and SE during the 2 years’ follow-up. This graph summarizes antibody responses measured during the follow-up for each individual. IgG responses against PvMSP (PV), PfMSPp19 (PF) and Schizont extract (SE) were stratified as function of the magnitude of responses i.e. negative (white square), positive (ODratio > 2 and < 5, light grey square) and strong (ODratio > 5, dark grey square). Missing samples are labeled na
