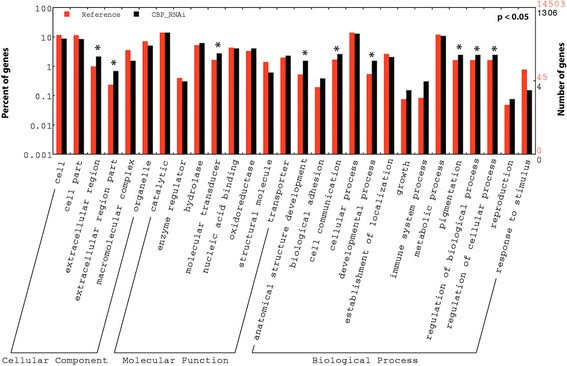
Fig. 5.

GO enrichment analysis. WEGO output for GO enrichment analysis with 1306 genes that were downregulated in Tribolium larvae after CBP knockdown. The plot shows percent and number of overrepresented GO terms compared to the reference genome (Tribolium genome). Asterisks indicated the statistically significant (p < 0.05) enrichment of important GO categories mainly under cellular component, molecular function and biological process categories after CBP RNAi
