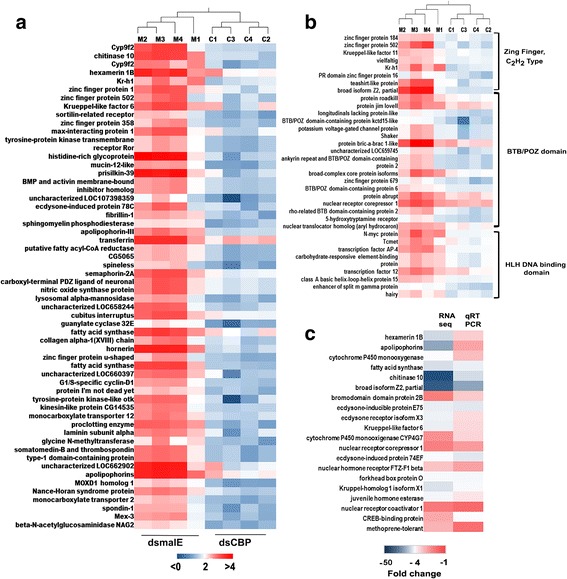
Fig. 6.

Post-EDGE data analysis. a Heatmap representing the expression levels of a subset of 53 genes in malE and CBP dsRNA-treated samples that clustered together with Kr-h1 after K-mer featured clustering of the data set containing 1306 downregulated genes in larvae injected with CBP dsRNA. b Heatmap showing the expression profile of Zinc finger, BTB/POZ, and HLH DNA-binding domain-containing genes in Tribolium larvae injected with CBP dsRNA. c Validation of RNA seq expression data by qRT-PCR using a subset of 20 genes. The fold change values obtained by qRT-PCR and RNA seq for each gene are plotted as a heatmap. Four biological replicates for each treatment (malE and CBP) were used for qRT-PCR analysis, and the mean fold change value of each gene was used in the heatmap. The experiment was repeated twice with comparable results
