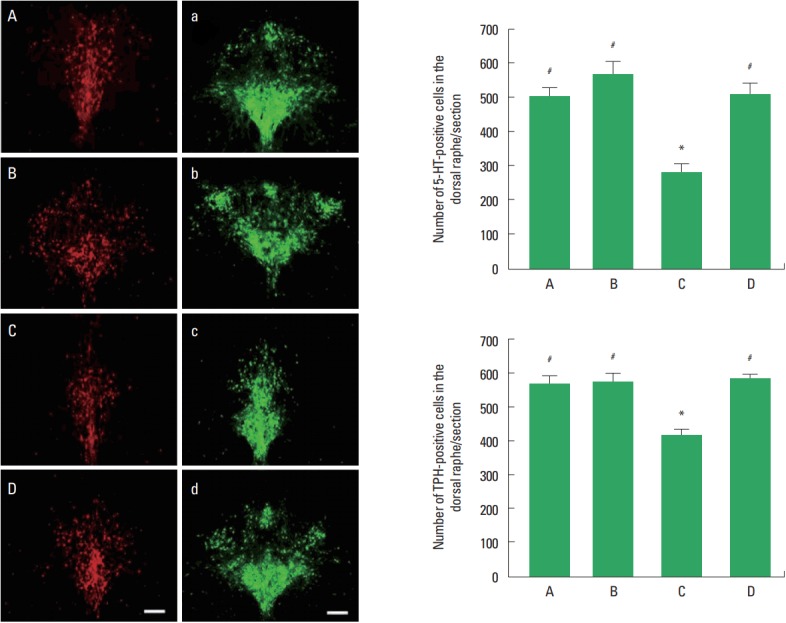
Fig. 2.

5-Hydroxytryptamine (5-HT) and tryptophan hydroxylase (TPH)-positive cells in the dorsal raphe. Left panel: Photomicrographs of 5-HT-positive and TPH-positive cells in the dorsal raphe. A and a, control group; B and b, exercise group; C and c, social isolation group; D and d, social isolation and exercise group. The scale bar represents 200 μm. Right panel: Number of 5-HT-positive and TPH-positive cells in each group. A, control group; B, exercise group; C, social isolation group; D, social isolation and exercise group. The data are represented as the mean± standard error of the mean. *P< 0.05 compared to the control group. #P< 0.05 compared to the social isolation group.
