Fig. 2.

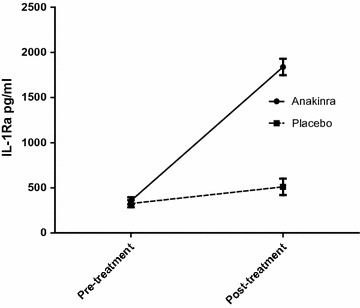
Concentration of IL-1Ra for patients treated with either anakinra or placebo. Displays IL-1Ra concentrations ± SEM in patients treated with either anakinra or placebo before and after treatment

Concentration of IL-1Ra for patients treated with either anakinra or placebo. Displays IL-1Ra concentrations ± SEM in patients treated with either anakinra or placebo before and after treatment