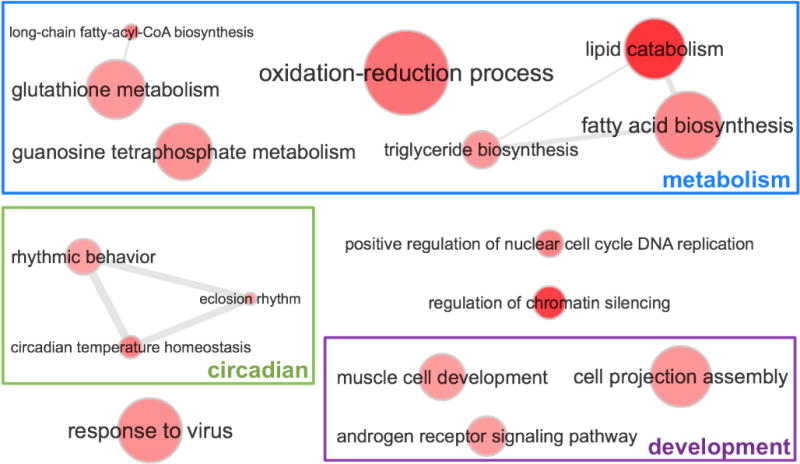
Figure 4. Enriched (P < 0.01) GO terms associated with interspecific divergence hotspots for the two Calephelis species.

The darkness of the color indicates the significance level (P-value) of the enrichment, with darker color corresponding to lower P-value. The size of the dots correlates to the number of proteins that are associated with this GO term encoded in the Drosophila melanogaster genome. The GO terms that are frequently associated with the same proteins are linked by the grey lines, and we also manually grouped the GO terms with similar biological meanings.
