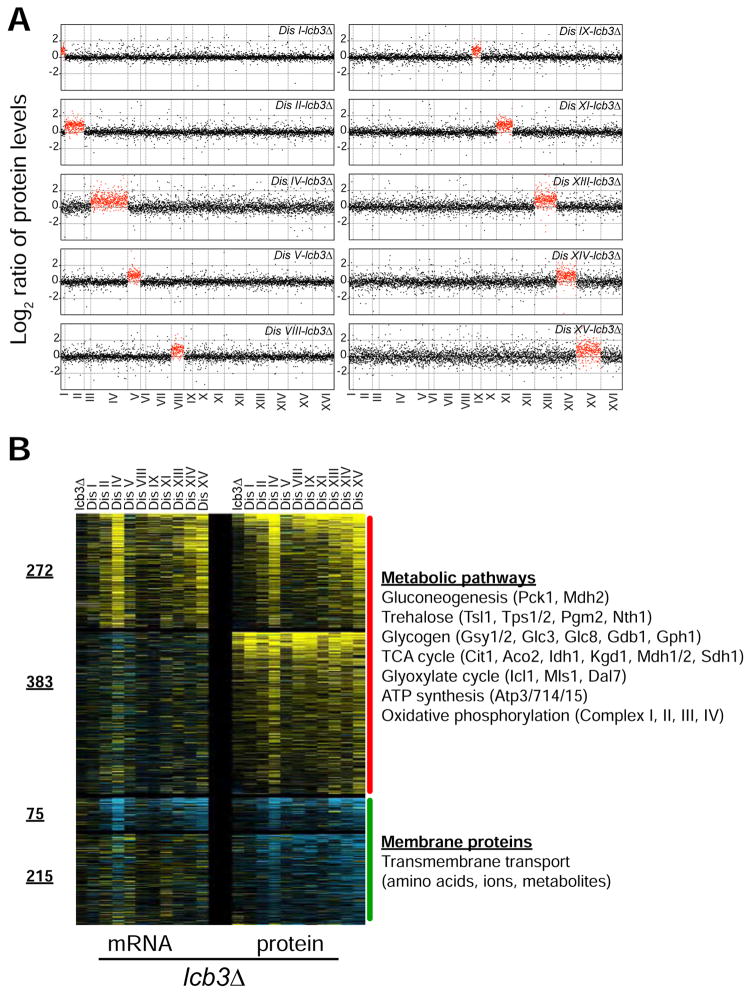
Figure 7. Loss of LCB3 Remodels Membrane Protein Composition and Promotes Anabolism and Mitochondrial Function.
(A) The plots show the log2 ratio of the relative protein abundance of disomes-lcb3Δ compared to WT. Protein levels are shown in the order of the chromosomal location of their encoding genes. Protein levels of duplicated chromosomes are shown in red.
(B) Transcript and protein abundances of genes that are specifically up- and down-regulated in the disomes upon the loss of LBC3. See Table S5 for GO enrichment analysis details.

