Figure 7.

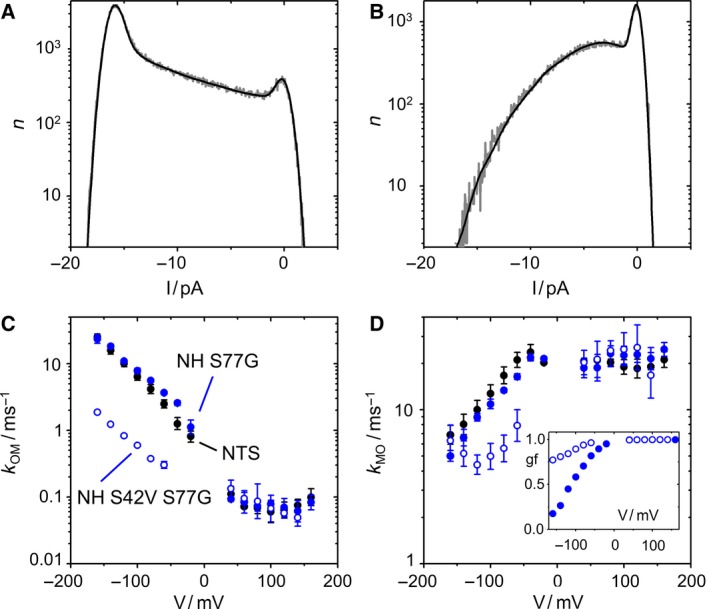
Influence of mutating Ser42 in the pore helix anchoring the selectivity filter (Fig. 1B) on O‐M gating at negative voltages. (A,B) Comparison of the amplitude histogram at −140 mV of KcvNH S42V S77G (A) with that of KcvNH S77G (B). Representative histograms in 0.1 m KCl, pH 7 (gray) and the best fit with the model in Fig. 2A (black). (C,D) Comparison of the voltage dependence of k OM (C) and k MO (D) of KcvNH S42V S77G (blue open circles) with that of KcvNH S77G (blue filled circles) and KcvNTS (black circles). Inset in D: Gating factor gf [Eqn (5)] for KcvNH S77G and KcvNH S42V S77G, symbols are the same as in (C) and (D). Recordings in symmetrical 0.1 m KCl from three different bilayers for each KcvNH mutant and six for KcvNTS, respectively.
