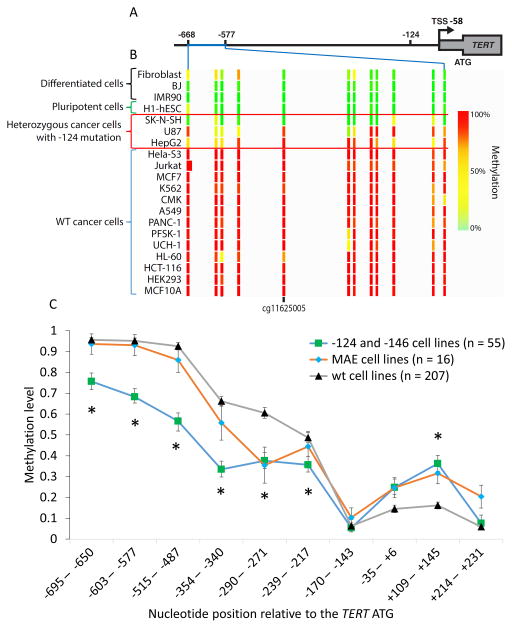
Figure 1. 5mC Levels at the TERT Promoter CGI Are Reduced in Cell Lines with −124 Mutations.
(A) The position of the TERT CGI relative to the −124 mutation, transcription start site (TSS) and ATG. The region of the TERT CGI displayed extends from −668 to −577 (Chr5:1,295,678 1,295,774 in HG19).
(B) ENCODE RRBS data indicate reduced 5mC at the CGI in −124 heterozygous cells vs. cancer cells with wt promoters. The position of cg11625005 is indicated (−633 from the TERT ATG). Direct bisulfite sequencing analyses are shown in Fig. S1. See Table S1 for cell types.
(C) Relative DNA methylation levels across the TERT CGI in CCLE cell lines (n=278). Cell lines are grouped by TERT promoter mutation status and monoallelic TERT expression status (MAE, wt promoter with monoallelic expression). Each value derives from RRBS data from one or more CpG; where CpG were pooled, pooling was based on nucleotide proximity. Data are median ± SEM. Significance test (see Methods) compared wt and −124/−146 cell lines; * p < 0.05.

