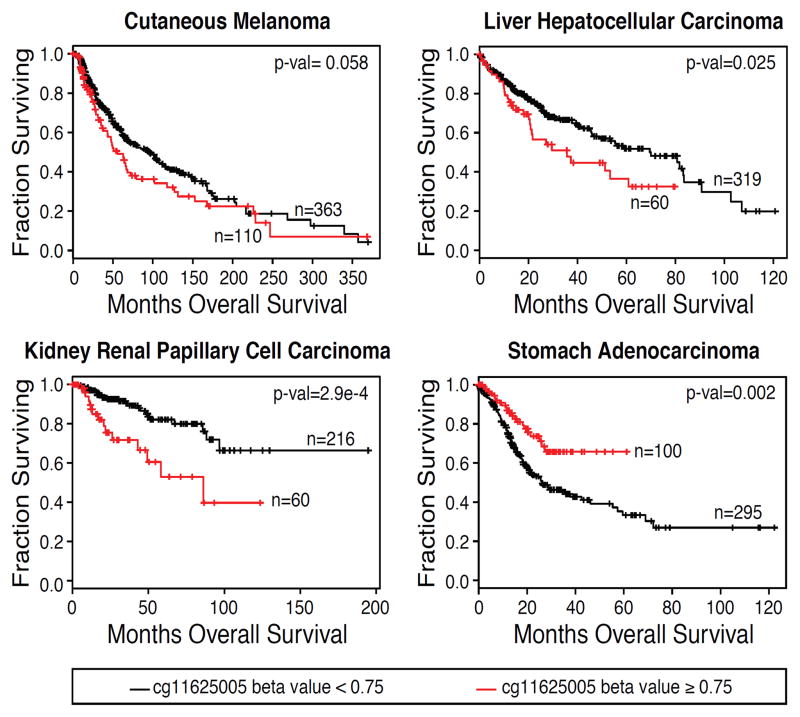
Figure 4. High Levels of 5mC at cg11625005 Correlate with Differences in Patient Survival in Specific Cancers.
Kaplan-Meier plots were generated for TCGA patient data with cancers that commonly harbor TERT promoter mutations (HCC, LIHC; cutaneous melanoma, SKCM) and cancers that do not typically harbor TERT promoter mutations (kidney renal papillary cell carcinoma, KIRP; stomach adenocarcinoma, STAD). Patients were stratified based on methylation (beta value) at cg11625005. Statistical comparison was done using the log-rank test (see methods for details).

