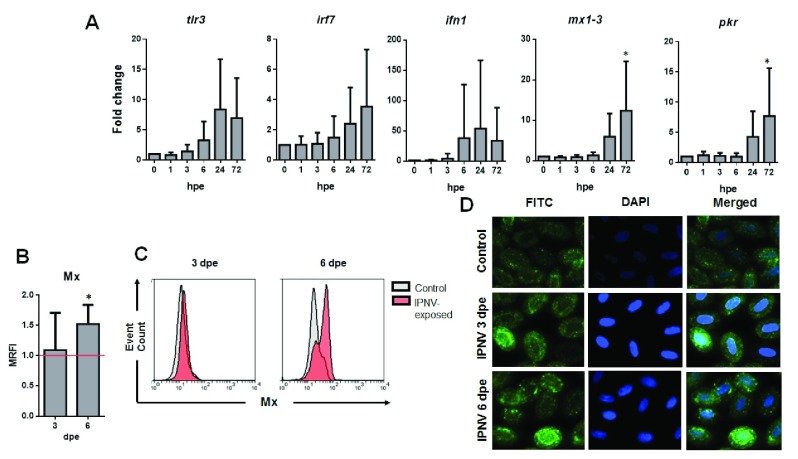
Figure 2. RBCs IFN-related antiviral response against IPNV.
( A) Gene expression of tlr3, irf7, inf1, mx1–3 and pkr in IPNV-exposed RBCs at the indicated times post-infection and MOI 0.5, measured by RT-qPCR. Data represesent mean±SD (n = 6). Kruskal-Wallis Test with Dunn´s Multiple Comparison post-hoc test was performed among all time-points post-exposure in comparison with control time point (0 hpi) (*, p-value < 0.05). ( B) Mx protein MRFI (mean relative fluorescent intensity, relative to control cells) in IPNV-exposed RBCs at MOI 0.5 (n = 5). ( C) Flow cytometry histograms of Mx protein expression from control (grey) and IPNV-exposed (red) RBCs at MOI 0.5 and the indicated days post-exposure (dpe). ( D) Representative immunofluorescence images of Mx protein expression in control and IPNV-exposed RBCs at MOI 0.5 (FITC – Mx protein expression, DAPI - Nuclei) (IF representative of 40 images).

