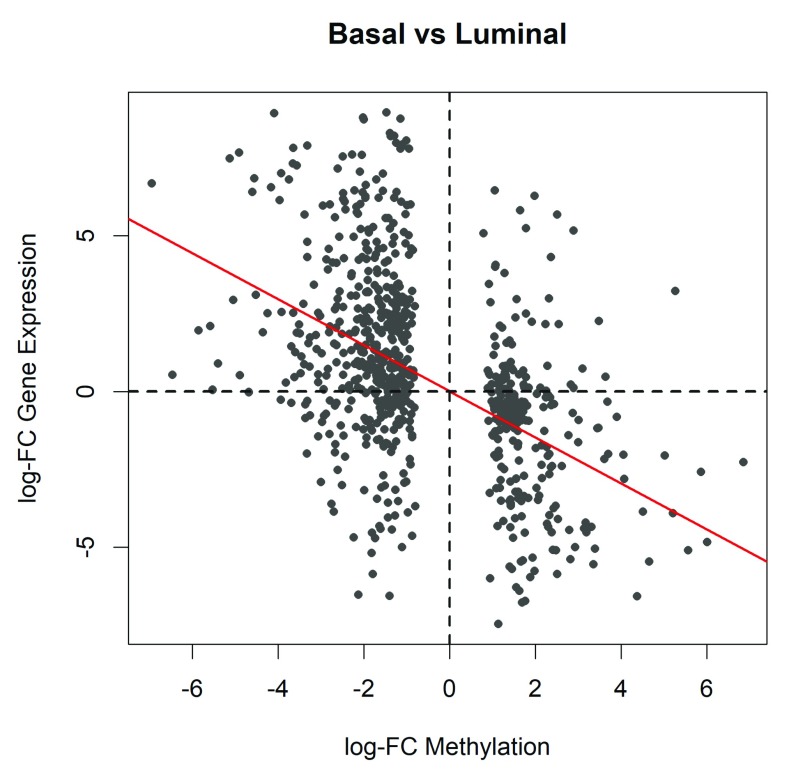
Figure 6. Scatter plot of the log-fold changes of methylation levels in gene promoters (x-axis) vs the log fold-changes of gene expression (y-axis).
The plot shows results for the genes of which the promoters are significantly differentially methylated between basal and luminal. The red line shows the least squares line with zero intercept. A strong negative correlation is observed.

