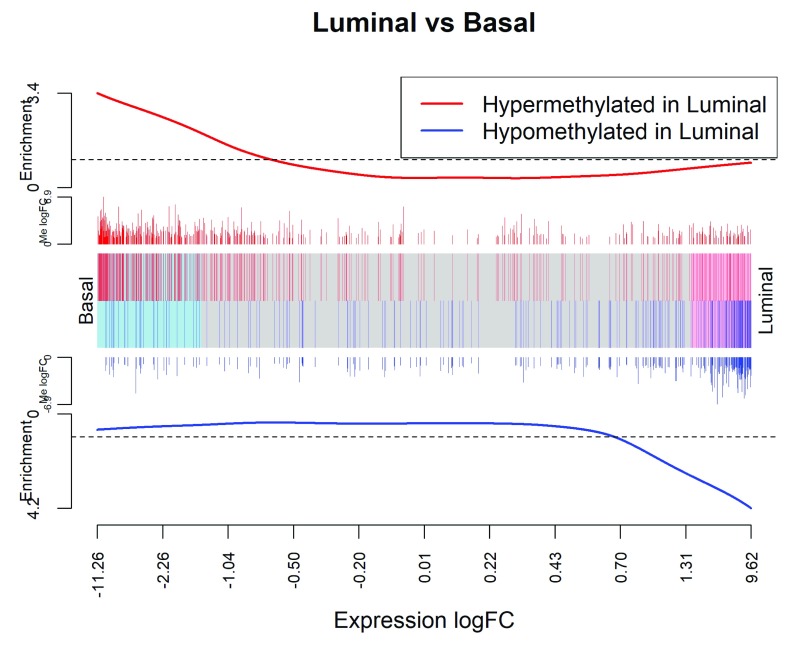
Figure 9. Barcode plot showing strong negative correlation between expression changes and methylation changes when luminal cells are compared to basal.
The plot is analogous to Figure 8 with the DM genes now displayed as gene sets and the methylation logFCs now displayed as gene weights.

