
Figure 5. NAc D1-MSNs show decreased mitochondria size following cocaine self-administration.
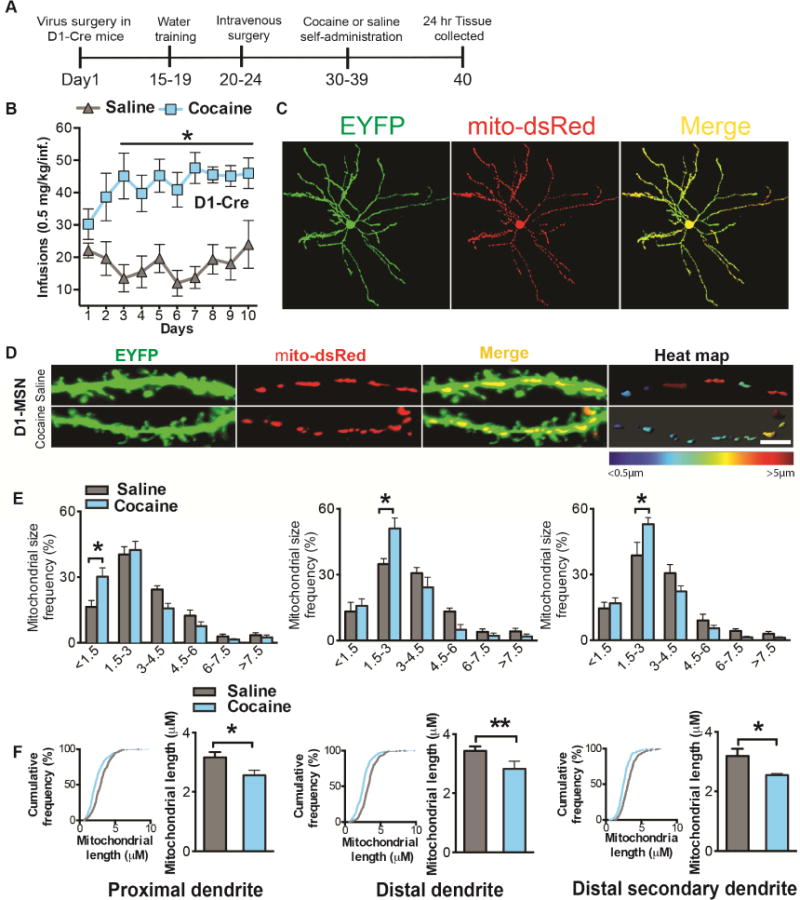
(A) Timeline of virus injection into NAc and cocaine self-administration in D1-Cre mice. Animals first receive Cre inducible virus to label MSN cell bodies (EYFP) and mitochondria (mito-dsRed). Two weeks later they were trained for water self-administration (FR1) for 4 days, followed by catheterization surgery. After recovery, mice self-administered cocaine (FR1) for 10 consecutive days. Finally, tissue was collected 24h following the last session. (B) D1-Cre mice developed stable cocaine intake (0.5mg/kg/infusion) from day 3 onward compared to saline controls (n=8 in each group): Two-way Repeated Measures ANOVA: Interaction: F(9,126)=2.913, p=0.0036, Tukey post-hoc: p<0.05. (C) Representative confocal images of a D1-MSN co-labeled with EYFP (green) and mito-dsRed (red). (D) Representative confocal images of D1-MSN dendrites (green) with labeled mitochondria (red) after cocaine or saline self-administration (left and middle panels). The right panel displays a heat map of mitochondrial length in MSN dendrites in cocaine and saline conditions. Scale bar 5μm. (E) 3D reconstruction of dendrites and mitochondria demonstrates an increase in the frequency of smaller length mitochondria in D1-MSN proximal (left; Two-way ANOVA: Interaction: F(5,48)=4.04, p=0.0039, Bonferroni post-hoc: p<0.01.), distal (middle; Two-way ANOVA: Interaction: F(5,48)=3.839, p=0.0053, Bonferroni post-hoc: p<0.01), and distal (right; Two-way ANOVA: Interaction: F(5,48)=4.51, p=0.0019, Bonferroni post-hoc: p<0.01) secondary dendrites in the cocaine group (n=6) compared to saline controls (n=4). (F) Cumulative frequency distribution plots. A shift to the left is observed in D1-MSN dendrites implicating overall reduced mitochondrial length in D1-MSNs. Kolmogorov-Smirnov test: the maximum difference between the cumulative distributions D=0.19, 0.21 and 0.19μm in D1-MSN proximal, distal and distal secondary dendrites respectively, p<0.0001. The overall length of mitochondria is reduced in D1-MSN proximal (Student’s t-test: t=2.337, df=8, p=0.04), distal (Student’s t-test: t=4.969, df=8, p=0.001) and distal secondary (Student’s t-test: t=2.911, df=8, p=0.02) dendrites in the cocaine (n=6) group as compared to saline (n=4). *p<0.05, **p<0.01. Error bars, SEM. See also Figure S5.