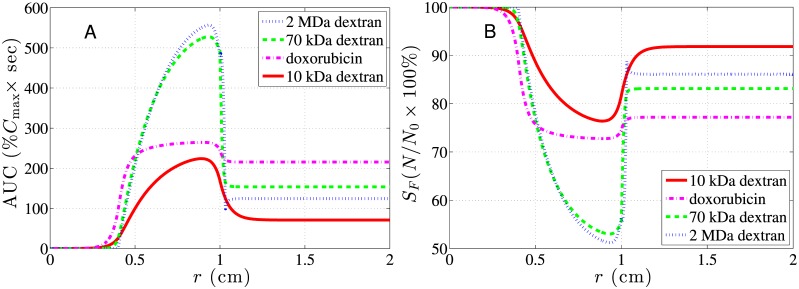
Fig 7. Spatial distributions of AUC and SF for dextrans and doxorubicin in a subcutaneous tumor.
A: The spatial distribution of 10-kDa, 70-kDa, 2-MDa dextrans and doxorubicin. B: The corresponding spatial distribution of the cell survival rates. The 2-cm (R = 1 cm) tumor with a 0.8-cm (Rn = 0.4R) necrotic region was immersed in a 1 cm thick normal tissues.

