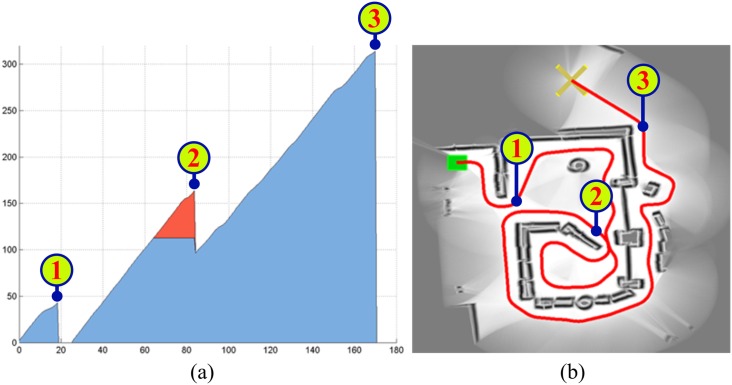
Fig 23. EG’s memory usage regarding the experiment of Fig 21.
During this experiment, two layers were created in the short-term memory. The amount of data—expressed in KB—stored in each layer at every time instant is represented in Fig (a). This amount of data is drawn in blue color for layer #1, and in red color for layer #2. Labels 1, 2, and 3 in Fig (a) and (b) correlate memory consumption with specific points of the trajectory followed by the robot.

