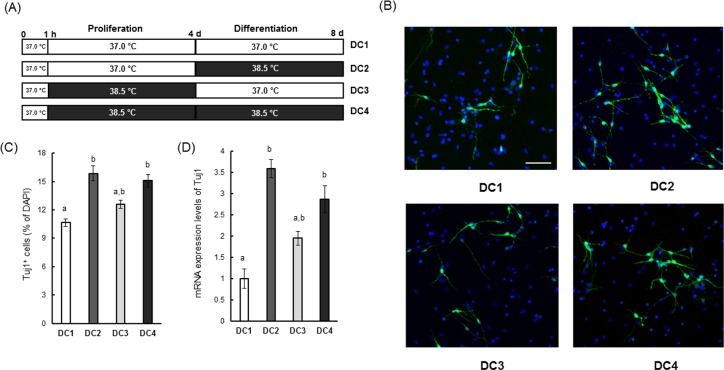
Fig 7. Neuronal differentiation of NSCs/NPCs induced by mild heat exposure.
(A) Culture of NSCs/NPCs under four different conditions. (B) Representative images of Tuj1-positive cells (green) on day 4 of differentiation. Nuclei were counterstained with DAPI (blue). White bar indicates 50 μm. (C) Quantification of Tuj1-positive cells. Data are expressed as percentage of total cells. Values are mean ± SEM of four independent experiments. Bars not sharing a common letter are significantly different at P < 0.05 by one-way ANOVA, followed by Tukey’s HSD for post-hoc comparisons. (D) Relative mRNA expression levels of Tuj1 on day 4 of differentiation. Values are the mean (±SEM) fold-increase in Tuj1 to 18S rRNA (internal control) ratio. The values of control temperature group were set to 1.0. Bars not sharing a common letter are significantly different at P < 0.05 by one-way ANOVA followed by Tukey’s HSD for post-hoc comparisons.

