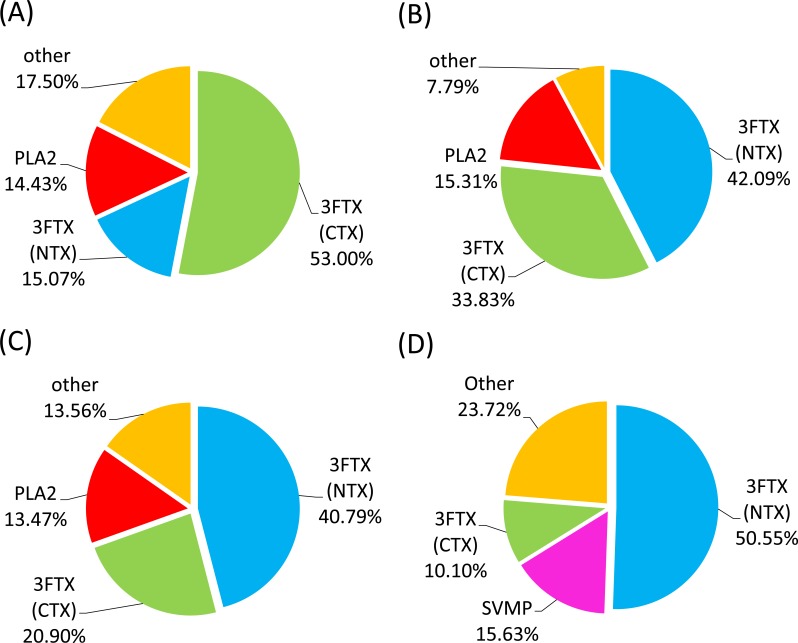
Fig 3. Pie charts showing the relative abundance of cobra venom protein families.
The composition of venom proteins from (A) N. naja, (B) N. kaouthia, (C) N. siamensis, and (D) O. hannah. Results are based on venom protein identification and HPLC peak intensity, and show the major protein components, expressed as a percentage.

