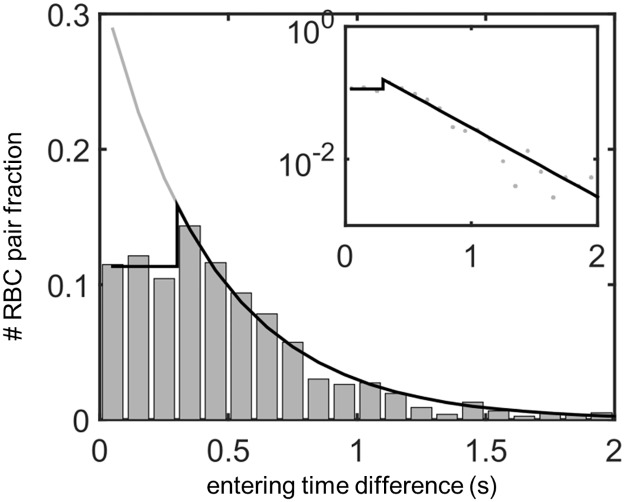
Fig 3. Red flood cell flows in the real intersegmental artery network are affected by feedbacks, as shown by a significantly lower fraction of red blood cells entering the same vessel within 0.3s of each other.
Shown: Distribution of inter-entry times for cells entering all 12 SeAs. In the absence of feedbacks, inter-entry times will be exponentially distributed (black curve), while real inter-entry times follow an exponential distribution only when cells enter the vessel more than 0.3s apart, and have uniform distribution when cells enter the vessel within 0.3s of each other (black star curve). Inset: The semi-log plot of the linear-exponential distribution (black curve) fits well to the data (gray dots) above 0.3s, showing the exponential distribution when the inter-entry time is long enough for the first cell to leave the vessel. We bin the inter-entry time intervals into 0.1s bins which is the typical time resolution of our videos.

