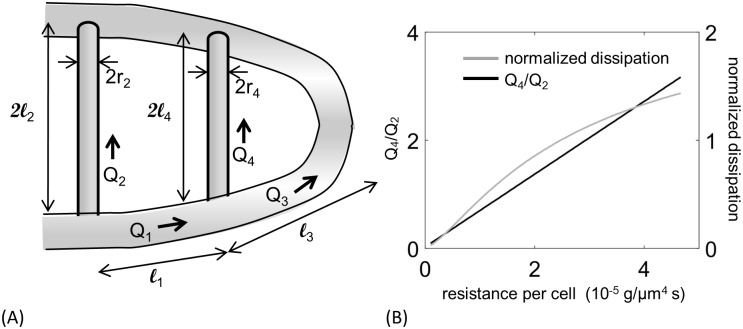
Fig 5. A reduced vascular network model shows that occlusive effects need to be varied between SeAs, and exposes trade-offs between flow uniformity and transport efficiency.
(A) Diagram of the reduced model of the network showing vessel lengths li, fluxes Qi, and radii ri. (B) Increasing the occlusion strength α2 increases flux uniformity, measured by the ratio of fluxes in the last and the first Se (black curve), but also increases dissipation (gray curve), if the total flux through both Se vessels is maintained.

