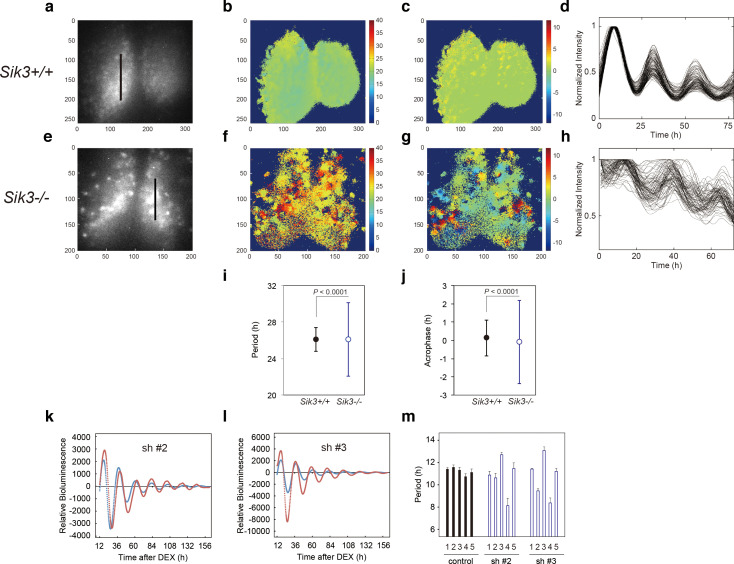
Figure 2. Varied circadian periods and phases in individual cells of the Sik3-/- suprachiasmatic nucleus (SCN).
Time-lapse single-cell bioluminescence images of ex vivo SCN explant cultures of (a) Sik3+/+; Per2Luc/Luc and (e) Sik3-/-; Per2 Luc/Luc mice were used for the following analyses: Period distribution on SCN slices of Sik3+/+ (b) and Sik3-/- (f). Acrophase distribution on SCN slices of Sik3+/+ (c) and Sik3-/- (g). Time series of the bioluminescence signals observed on a Sik3+/+ SCN slice along the bold line indicated in a) (d), and those from a Sik3+/+ SCN slice along the bold line indicated in (b) (h). The original signals were smoothed via a moving average filter, and then normalized. (i) Period distribution in representative Sik3+/+ and control slices. p<0.0001 vs. Sik3-/- (test for equality of variance, F-test). (j) Acrophase distribution of representative Sik3+/+ and Sik3-/- slices. p<0.0001 vs. Sik3-/- (F-test). (k) and l) Representative Bmal1-luc rhythms of Sik3-KD NIH3T3 (sh #2 and #3, red) and control cells (blue). (m) Averaged sequential half-periods (peak-to-trough or trough-to-peak) of Bmal1-luc rhythms in KD and control NIH3T3 cells as shown in (k and l) (n = 4 per group). Numbers (1–5) on the x-axis present the first half-period (hours from first trough to second peak) to the fifth half-period (hours from third trough to fourth peak).


