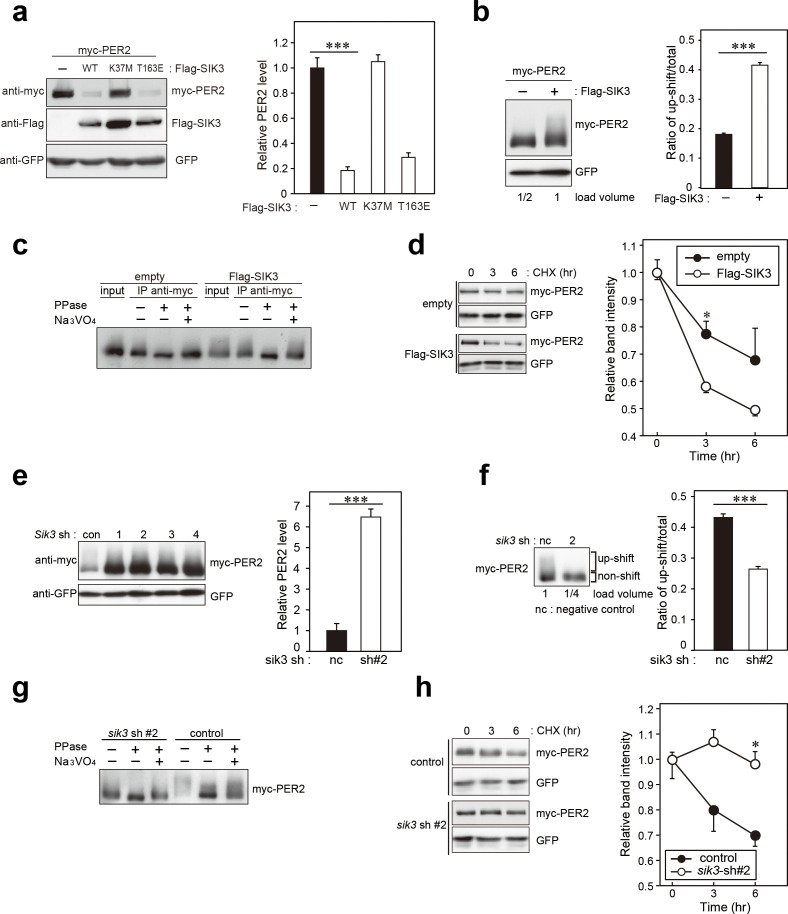
Figure 3. SIK3 alters expression levels and phosphorylation states of PER2 protein.
(a) HEK293T17 cells were transfected with SIK3 and PER2 expressing constructs, and the effect on PER2 expression levels was examined by western blotting analysis. Overexpression of SIK3 (SIK3-OX) in HEK293T17 cells (WT) and constitutively active SIK3 cells (T163E), but not kinase-deficient SIK3 mutant cells (K37M), significantly reduced PER2 protein levels (n = 3, p<0.001 by Tukey’s test). (b) Load volume of cell lysates in western blotting analysis was adjusted for comparison of phosphorylation rate. Adjustment of PER2 levels in SIK3-OX and non-OX controls revealed increased rates of upshifted PER2 protein (upshift/total) in NIH3T3 cells (n = 3, ***p<0.001 vs. controls by Student’s t-test). (c) Myc-tagged PER2 co-expressed with SIK3 was purified from HEK293T17 cell lysate and incubated with λPPase for 30 min at 30°C. PER2 up-shift was decreased after λPPase treatment in SIK3-OX cells, which was attenuated by phosphatase inhibitor, Na3VO4. (d) PER2 degradation assay was performed in Sik3-OX cells. Cells were collected at 0, 3, and 6 hr after the addition of CHX. PER2 protein levels at the starting point (t = 0) were normalized to 1. All data used for quantification are shown in Figure 3—figure supplement 2b (n = 3, *p<0.05 by Student’s t-test). Sik3-OX cells accelerated PER2 degradation. (e) NIH3T3 cells were transfected with each shRNAs of Sik3 (SIK3-KD, #1–4) or negative control shRNA. All SIK3-KD significantly increased PER2 levels (n = 3, p<0.05 by Tukey’s test). Another set of samples is also shown in Figure 3—figure supplement 3a. (f) Sik3-KD in NIH3T3 cells reduced PER2 up-shift. Load volume of cell lysates in western blotting analysis was adjusted for comparison of phosphorylation rate (n = 3 for control and shRNA#2, ***p<0.001 vs. controls by Student’s t-test). (g) λPPase treatment with Myc-PER2 purified from cell lysates of control cells or Sik3-KD cells. PER2 up-shift was decreased after λPPase treatment in SIK3-OX cells, which was attenuated by phosphatase inhibitor, Na3VO4. (h) PER2 degradation assay in Sik3-KD cells was performed. PER2 protein levels at the starting point (t = 0) were normalized to 1 (n = 3, *p<0.05 by Student’s t-test).
Figure 3—figure supplement 1. Constitutive active mutant, but not kinase-deficient SIK3, alters PER2 abundance in NIH3T3 cells.


