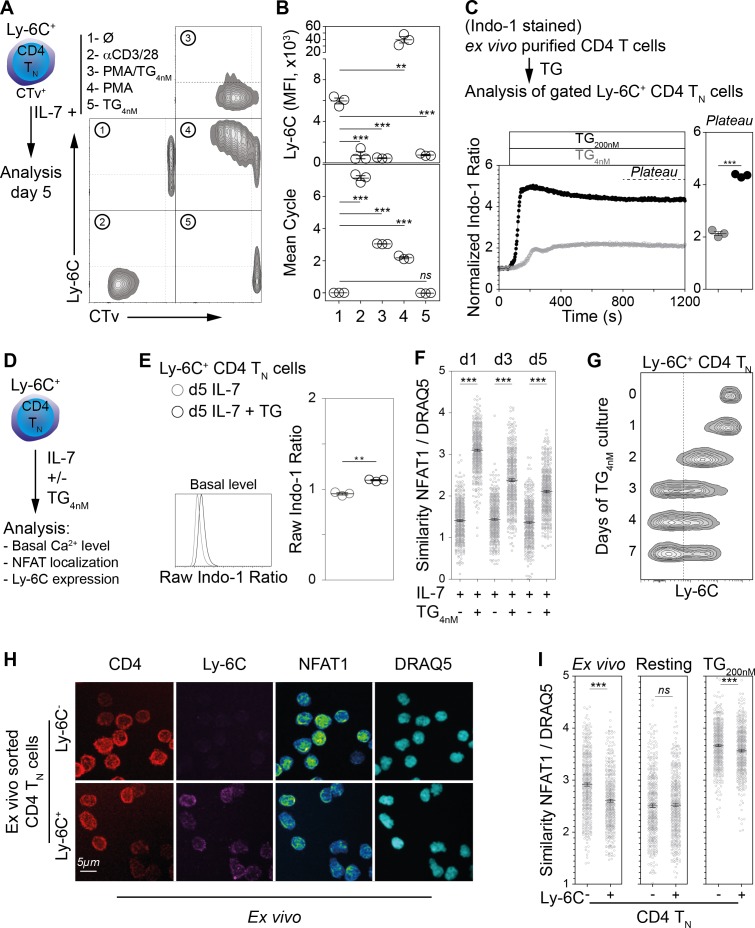
Figure 4. Ly-6C- CD4 TN-cell phenotype relies upon calcium signaling pathway in vitro.
(A–B) Flow-cytometry sorted Ly-6C+ CD4 TN cells from C57BL/6 Foxp3-GFP mice were labelled with CTv and cultured in IL-7 (10 ng/ml) in the presence of either coated αCD3/28 (4µg/ml), PMA and TG (1.25 ng/ml and 4 nM, respectively), PMA alone (1.25 ng/ml) or TG (4 nM). Cells were recovered and analyzed after 5 days of culture. (A) Representative Ly-6C/CTv contour-plots are shown. (B) Ly-6C Mean fluorescence intensities (MFIs), for gated CD4+ TCR+ cells, are shown as means ± s.e.m. for a representative experiment with three mice per group (upper panel). Mean cell cycle numbers were calculated (lower panel). (C) Ex-vivo-purified CD4 T cells from C57BL/6 Foxp3-GFP mice were stained with Indo-1 and cell surface molecules CD44, Ly-6C and lineage markers (CD11c, CD11b, CD8β, CD25, TCRγδ and NK1.1). Intracellular calcium concentration was assessed before and after stimulation with 4 or 200 nM TG to the extracellular medium and monitored by flow cytometry for 20 min; results are presented as normalized ratio of Indo-1 emission at 405 nm to that at 510 nm (405/510) for gated Ly-6C+ CD4 TN cells (Lineage- Foxp3-GFP- CD44lo Ly-6C+ cells). Normalized Indo-1 ratio at the Plateau are shown as means ± s.e.m. for a representative experiment (out of two independent experiments) with three mice per group (Each dot represents an individual mouse). (D–G) Flow-cytometry sorted Ly-6C+ CD4 TN cells from C57BL/6 Foxp3-GFP mice were cultured in the presence of IL-7 (10 ng/mL) with TG (4 nM) or not. (D) Diagram illustrating the experimental protocol. (E) Basal intracellular calcium concentration was assessed, as in C, after 5 days of culture. Raw Indo-1 ratio are shown as means ± s.e.m. for a representative experiment (out of two independent experiments) with three mice per group (each dot represents an individual mouse). (F) After 1, 3 and 5 days of culture, cells were analyzed by imaging flow cytometry. NFAT1 nuclear localization was calculated as similarity score between NFAT1 and DRAQ5 intensities. Data are representative of one of two independent experiments. (G) Cells were analyzed after 0, 1, 2, 3, 4 and 7 days of culture. Representative Ly-6C contour plots are shown for gated CD4 TN cells (CD4+ CD44lo CD25lo Foxp3-GFP-) are shown. (H, I) LN cells were isolated from C57BL/6 mice and fixed in 4% paraformaldehyde immediately (Ex vivo) or after 30 min of culture in the presence of 200 nM of TG (TG) or not (Resting). Ly-6C- and Ly-6C+ CD4 TN cells (CD4+ CD44lo CD25lo Foxp3-) were sorted by flow cytometry and stained for NFAT1, and DNA (DRAQ5). (H) Cells were analyzed by confocal microscopy; CD4 (Red), Ly-6C (Magenta), NFAT1 (pseudocolor) and DNA (DRAQ5, cyan) fluorescence are shown for ‘ex vivo’ purified Ly-6C- (upper panel) and Ly-6C+ (lower panel) CD4 TN cells. Original magnification ×63. (I) Cells were analyzed by imaging flow cytometry and NFAT1 nuclear localization assessed as in F. Data are representative of one of three independent experiments. (B, C, E, F, I) Significance of differences were assessed using a two-tailed unpaired Student’s t-test. Values of p<0.05 were considered as statistically significant (**p<0.01; ***p<0.001; ns, not significant).
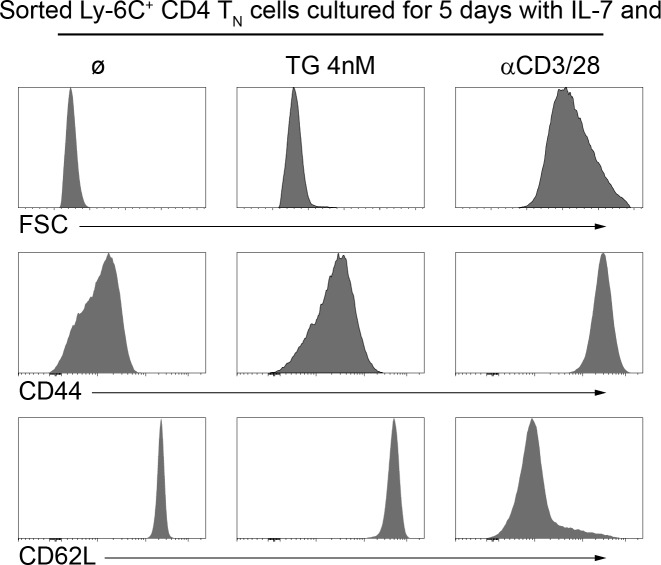
Figure 4—figure supplement 1. ‘Ca2+-converted’ Ly-6C+CD4 TN cells keep a naive phenotype.
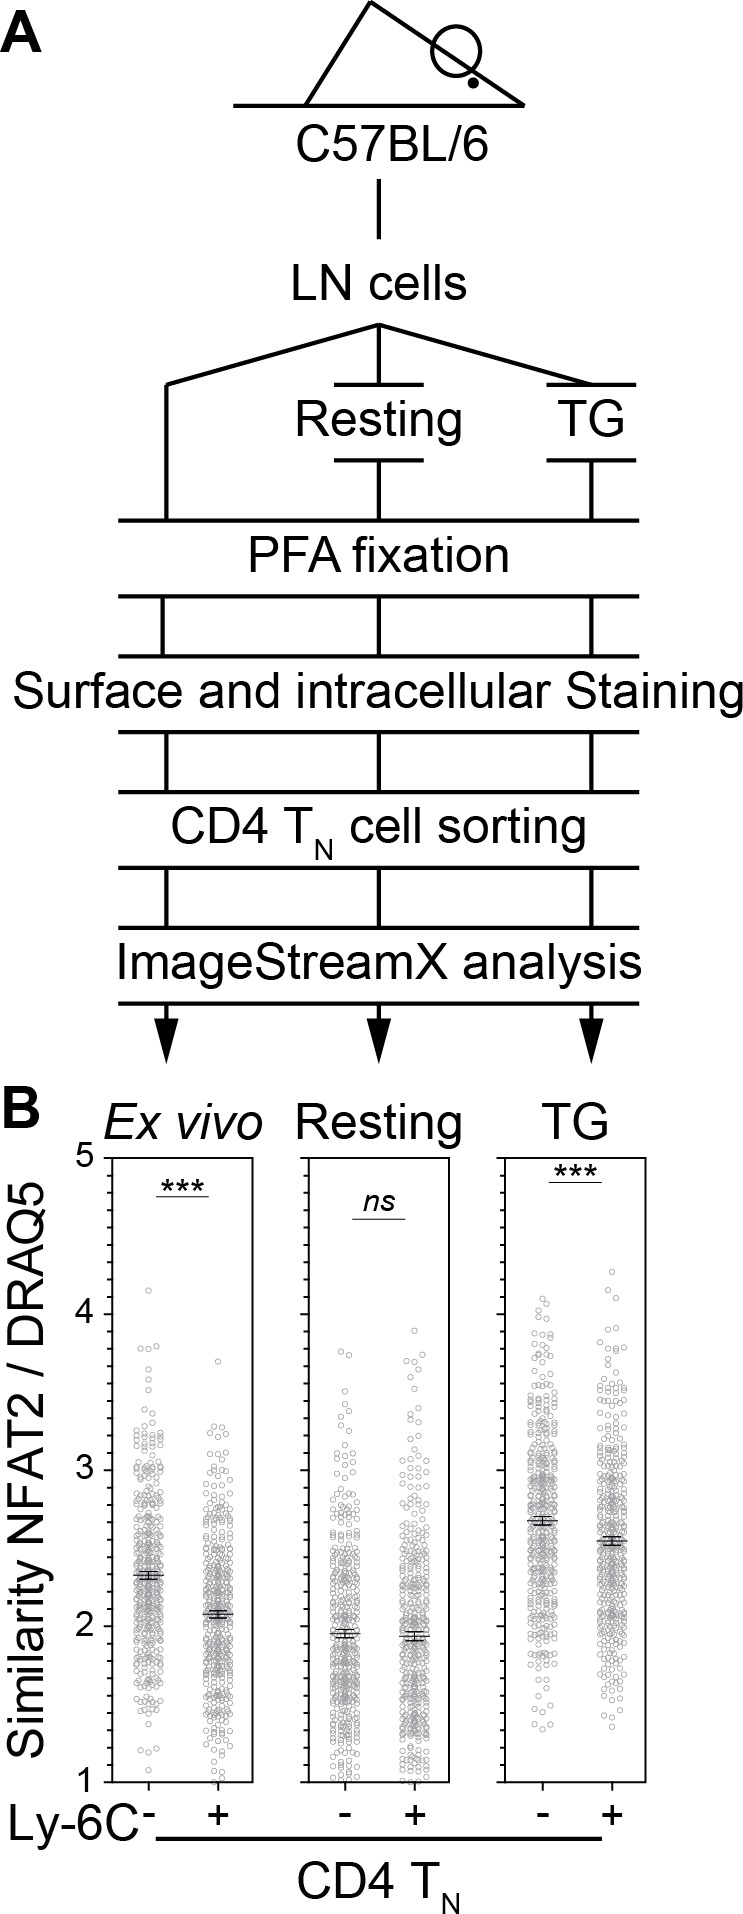
Figure 4—figure supplement 2. NFAT2 localization is more nuclear in Ly-6C- CD4 TN cells than in their Ly-6C+-cell counterparts.


