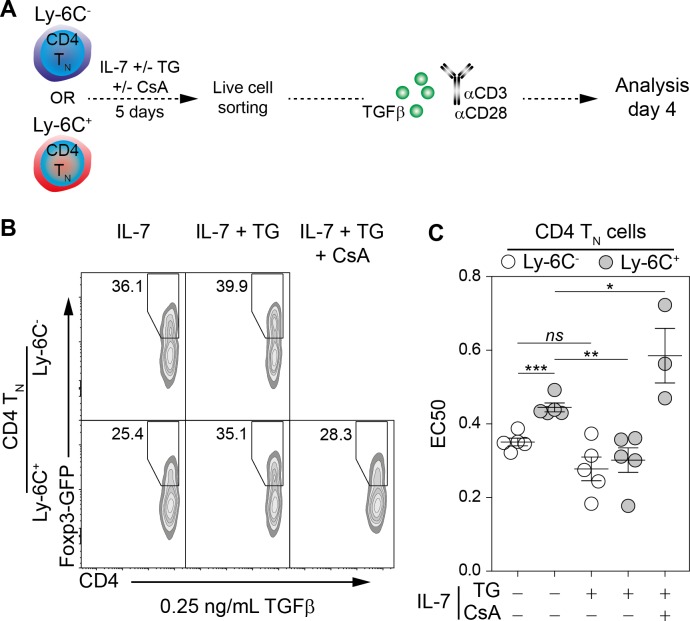
Figure 6. Ly-6C- CD4 TN-cell sensitization to iTreg-cell polarization signals relies upon calcium signaling pathway in vitro.
Flow-cytometry sorted Ly-6C- and Ly-6C+ CD4 TN cells from C57BL/6 Foxp3-GFP mice were cultured in IL-7 (10 ng/mL) with or without TG (4 nM) and CsA (50 nM). After 5 days, live cells were flow-cytometry sorted and stimulated with coated αCD3 and αCD28 Abs (4 µg/ml) in the presence of graded doses of TGFβ1. Cells were analyzed after 4 days of stimulation. (A) Diagram illustrating the experimental procedure. (B) Representative Foxp3/CD4 contour-plots and proportions of Foxp3+ cells for gated CD4+ cells are shown at a dose of 0.25 ng/mL TGFβ1, as a function of pre-culture condition. (C) Concentrations of TGFβ1 needed to obtain 50% of the maximal percentage of iTreg-cell polarization (EC50) were calculated for each CD4 TN-cell subset and each pre-culture condition. Each dot represents an independent experiment. Significance of differences were assessed using a two-tailed paired Student’s t-test. Values of p<0.05 were considered as statistically significant (*p<0.05; **p<0.01; ***p<0.001; ns, not significant).

