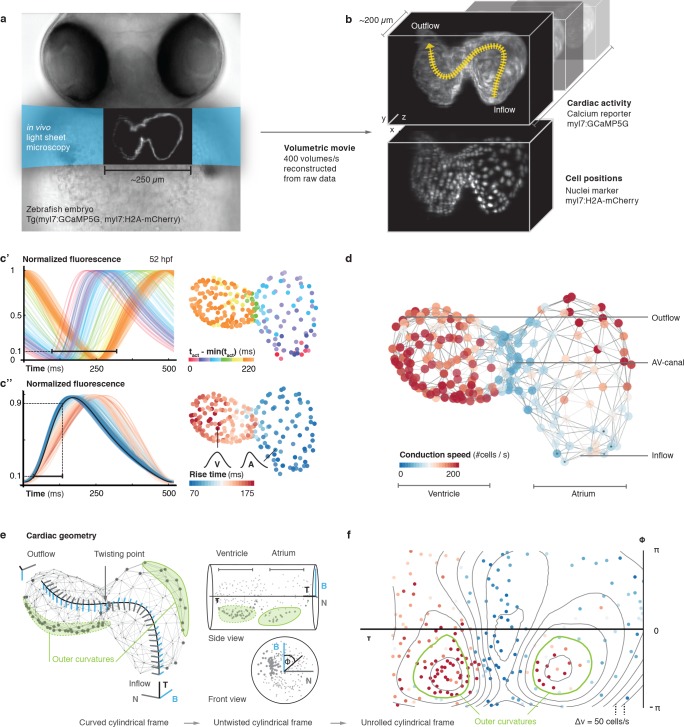
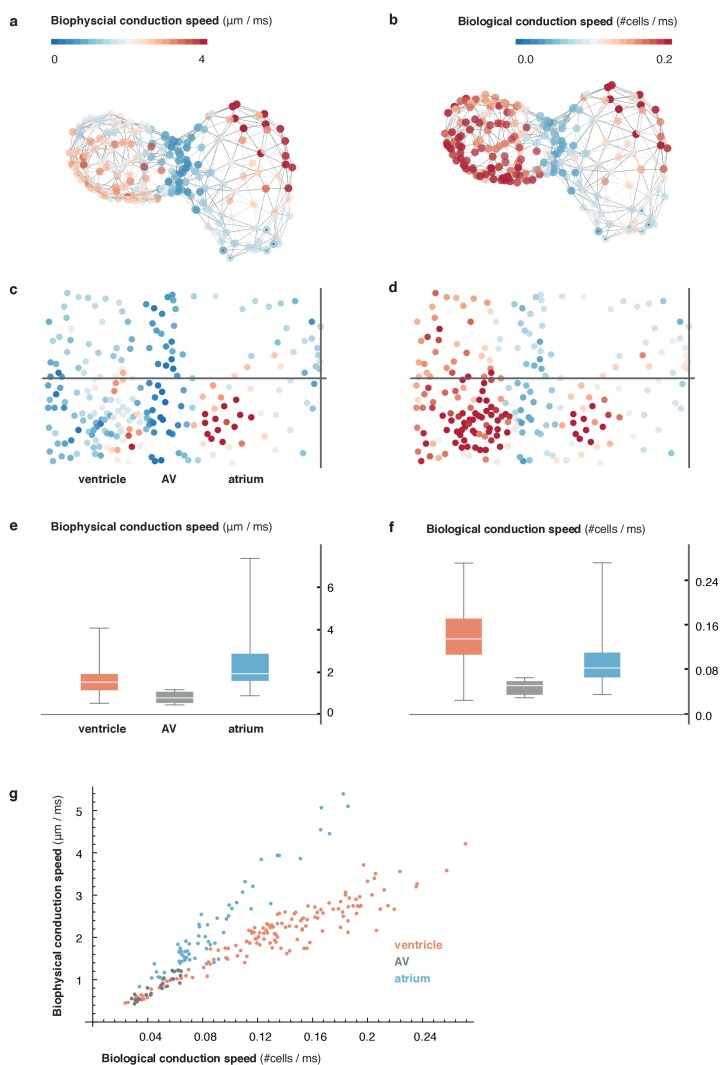
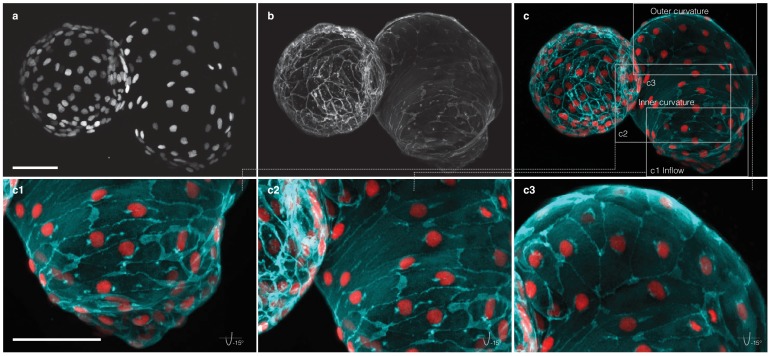
Figure 1. In vivo 3D optical mapping reveals cell-specific calcium transient patterns at 52 hr post fertilization (hpf).
(a) Transmitted light microscopy image with ~250 µm-sized, two-chambered heart (shown as fluorescence image with light sheet illumination path). (b) Genetically encoded fluorescent markers expressed in myocardial cells report calcium transient activity and cell positions. Volumetric movies were reconstructed from multiple high-speed movies, each with a temporal resolution of 2.5 ms and a voxel size of 0.5 µm in xy and 1 µm in z. Image data are available at Weber et al. (2017). (c’) Normalized fluorescence plot of every cell’s calcium transient over one cardiac cycle. The network’s activation timing (tact) is visualized in 3D based on the time-point of 10% calcium transient amplitude in every individual cell (right, same color scale). (c’’) Normalized fluorescence plot of all calcium transients, aligned in time based on the timing of deviation from minimal fluorescence intensity (3D network, same color scale). (d) Biological conduction speed, expressed as cells activated per unit of time, is visualized on the 3D network. (e) The basis vectors of the local coordinate system (tangent – black, normal – grey, and binormal – blue) are shown, moving along the centerline. The initial and final orientation of the moving reference frame is shown in a zoomed version at inflow and outflow sites. Outer curvature regions of atrium and ventricle are highlighted in green. (f) The unrolled cylinder results in a representation of 3D network function in a 2D map. Projections show conduction speed across the entire myocardium; iso-velocity lines (Δv = 50 cells/s) are shown in black. Outer curvature regions in atrium and ventricle are highlighted in green.

