. 2017 Dec 12;6:e30115. doi: 10.7554/eLife.30115

Figure 1. Sweet GRNs, but not sugar Gr genes, are necessary for fatty acid taste.

(A) Sweet GRNs are necessary for fatty acid sensing. Inactivation of sweet GRNs (Gr64f-GAL4/UAS-TNT) leads to loss of PER responses to both sucrose and fatty acids. Control flies (Gr64f-GAL4/+ and UAS-TNT/+) show robust PER responses to fatty acids and sucrose. Each bar represents the mean ± SEM of PER responses (n = 60–70 flies). Bars with different letters are significantly different (Kruskal-Wallis test by ranks with Dunn’s multiple comparison tests, p<0.05). Each y-axis delineates groups for Kruskal-Wallis test. (B) Sugar Gr genes are dispensable for fatty acid sensing. Octuple mutant flies lacking all sugar Gr genes (Gr5aLexA;ΔGr61aΔGr64a-f) exhibit PER responses to fatty acids similar to flies with functional sugar Gr genes (w1118), but they have severely reduced PER response to sucrose. The residual PER responses to sucrose of octuple mutant flies is mediated by Gr43a (Miyamoto et al., 2012). Each bar represents the mean ± SEM of PER responses (n = 42–83 flies). Asterisks indicate a significant difference between the mutant and control flies (Two-tailed, Mann-Whitney U test, ***p<0.001, ns: not significant). Each y-axis delineates groups for Mann-Whitney U test. The genotype of octuple mutant flies is R1 Gr5aLexA; +; ΔGr61a ΔGr64a-f (Yavuz et al., 2014). Source data for summary graphs are provided in Figure 1—source data 1.
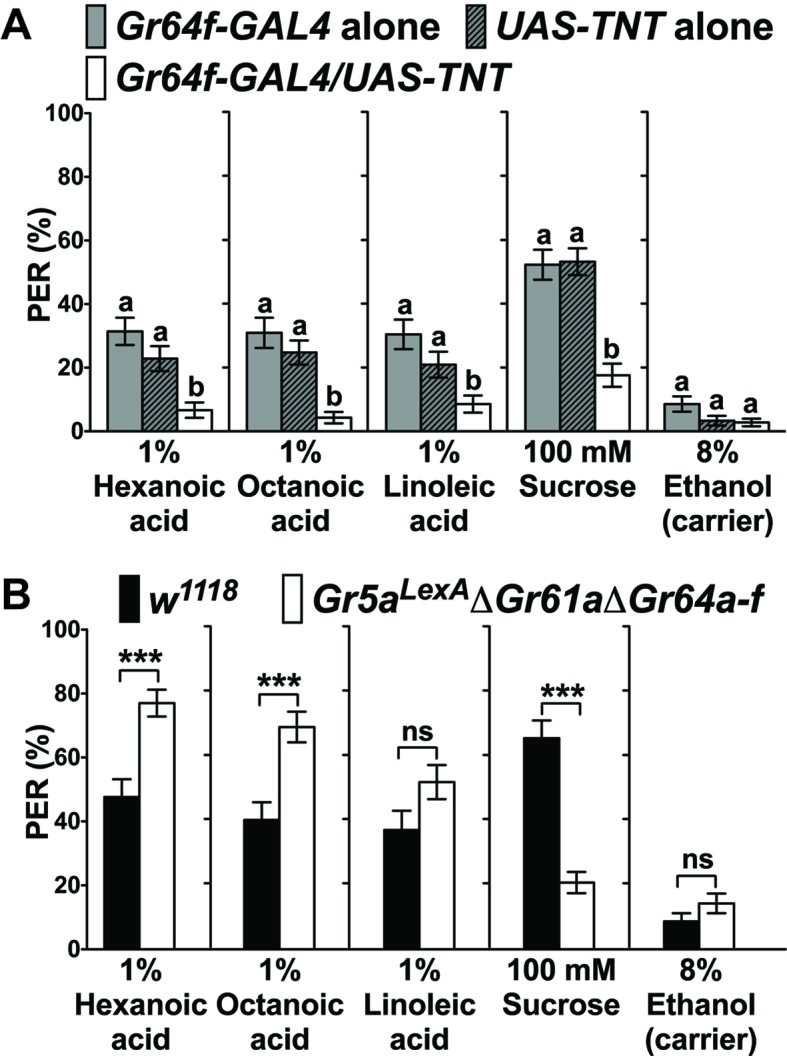
Figure 1—source data 1. PER responses to fatty acids of flies with impaired neurons and genes.
(A) PER responses of sweet GRNs to fatty acids when inactivated by expression of UAS-TNT. (B) PER responses of octuple mutant flies lacking all sugar Gr genes (Gr5aLexAΔGr61aΔGr64a-f) to fatty acids.
DOI: 10.7554/eLife.30115.007

Figure 1.

Figure 1—figure supplement 1. Flies show robust PER responses when the leg is stimulated, but is weaker when the labial palps are stimulated.

Figure 1—figure supplement 1.

No difference in PER responses to sugar is observed between the leg and the labial palp stimulation. Each bar represents the mean ± SEM of PER responses (n = 42–118 flies). Asterisks indicate a significant difference between the leg and the labellum of wild-type flies (w1118) (Two-tailed, Mann-Whitney U test, ***p<0.001, *p<0.05, ns: not significant). Each y-axis delineates groups for Mann-Whitney U test. Source data for summary graphs are provided in Figure 1—figure supplement 1—source data 1.
Figure 1—figure supplement 1—source data 1. PER responses to fatty acids upon stimulation of legs and labellum of wild-type flies (w1118) .
DOI: 10.7554/eLife.30115.004

Figure 1—figure supplement 2. PLC signaling is required for sweet GRN responses to fatty acids.

Figure 1—figure supplement 2.

Ca2+ responses of the 5b-, 5s-, or 5v-associated sweet GRNs of norpA mutant flies to indicated ligands. Ca2+ responses to hexanoic and octanoic acids are significantly reduced in the 5b (A)- and the 5s (B)-associated sweet GRNs of norpA mutant flies, and they are fully or partially rescued when UAS-norpA is expressed in sweet GRNs. Ca2+ responses to linoleic acid are significantly reduced only in the sweet GRN associated with 5s (B) and 5v (C) sensilla from norpA mutant flies. Each bar represents the mean ± SEM of Ca2+ imaging with 3–35 female prothoracic legs. Bars with different letters are significantly different (Kruskal-Wallis test by ranks with Dunn’s multiple comparison tests, p<0.05). Each y-axis delineates groups for Kruskal-Wallis test. Fly genotypes: Gr64f-GAL4 UAS-GCaMP6m/+ (Control, black bar), norpAP24; Gr64f-GAL4 UAS-GCaMP6m/+ (norpA-/-, white) and norpAP24; Gr64f-GAL4 UAS-GCaMP6m/UAS-norpA (Rescue, grey). Source data for summary graphs are provided in Figure 1—figure supplement 2—source data 1.
Figure 1—figure supplement 2—source data 1. Ca2+ responses of sweet GRNs associated with 5b (A), 5s (B) or 5v (C) sensilla of norpA mutant flies to fatty acids.
DOI: 10.7554/eLife.30115.006