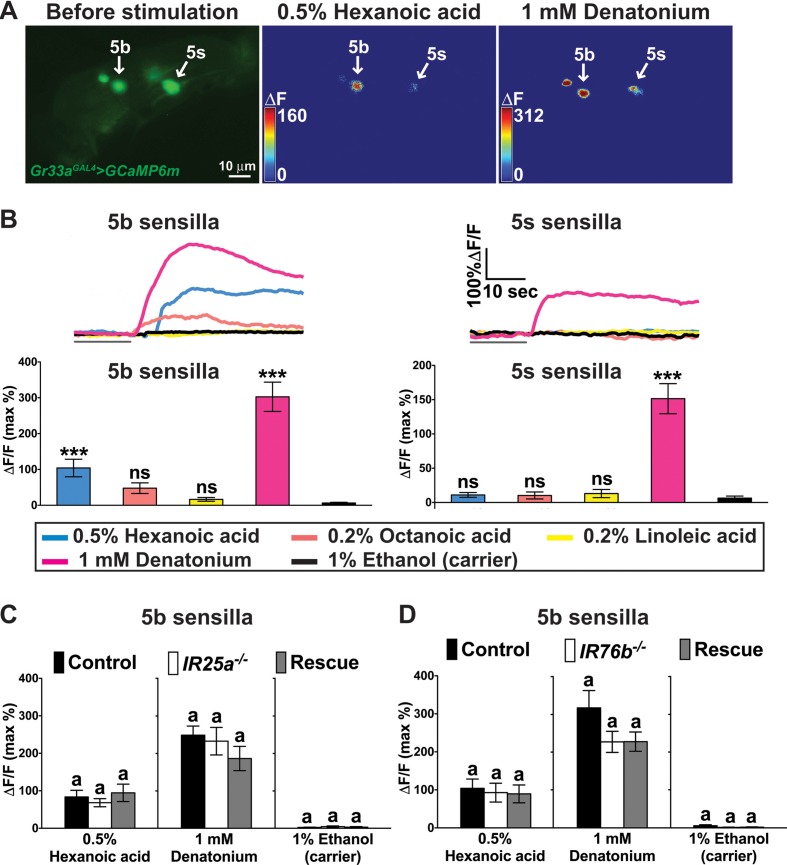
Figure 6. A subset of bitter GRNs responds to hexanoic acids in an IR25a/IR76b independent manner.
(A) Representative still images of the fifth tarsal segment of the prothoracic leg show maximum Ca2+ responses in the bitter GRNs associated with 5b and 5 s sensilla upon stimulation by indicated ligands. ΔF indicates the changes in fluorescence light intensity of the cell body before/after ligand application. (B) Representative fluorescence traces (top) and corresponding Ca2+ responses (bottom) of the 5b- and 5s-associated bitter GRNs upon stimulation by indicated ligands. The gray line underneath the fluorescence traces indicates time of ligand application. Hexanoic acid elicits highly significant Ca2+ responses in the 5b- associated bitter GRNs (compared to carrier). 1 mM denatonium was used as a positive ligand control. 1% ethanol was used as a carrier to facilitate solubilization of high concentrations of hexanoic acid (2.5%). Each bar represents the mean ± SEM of Ca2+ imaging with 10–30 female prothoracic legs. Two-tailed, Mann-Whitney U test versus carrier (1% ethanol), ***p<0.001, ns: not significant. Fly genotype is Gr33aGAL4 UAS-GCaMP6m/+. (C and D) Cellular responses to fatty acid in bitter GRNs do not require IR25a and IR76b. Ca2+ responses of the 5b-assoicated bitter GRNs of IR25a (C) or IR76b (D) mutant flies to indicated ligands. Ca2+ responses of GRNs of mutants to hexanoic acid were not significantly reduced when compared to control flies. Each bar represents the mean ± SEM of Ca2+ imaging with 4–42 female prothoracic legs. Bars with different letters are significantly different (Kruskal-Wallis test by ranks with Dunn’s multiple comparison tests, p<0.05). Each y-axis delineates groups for Kruskal-Wallis test. Fly genotypes C: Gr33aGAL4/+; UAS-GCaMP6m/+ (Control, black), IR25a2 Gr33aGAL4/IR25a2; UAS-GCaMP6m/+ (IR25a-/-, white), and IR25a2 Gr33aGAL4/IR25a2 UAS-IR25a; UAS-GCaMP6m/+ (Rescue, grey); Fly Genotypes D: Gr33aGAL4 UAS-GCaMP6m/+ (Control, black), Gr33aGAL4 UAS-GCaMP6m/+; IR76b2/IR76b2 (Ir76b-/-, white) and Gr33aGAL4 UAS-GCaMP6m/UAS-IR76b; IR76b2/IR76b2 (Rescue, grey). See Figure 6—figure supplement 1—source data 1 for hexanoic acid responses of 5s-associated bitter GRNs from IR25a or IR76b mutant flies. Source data for summary graphs are provided in Figure 6—source data 1.
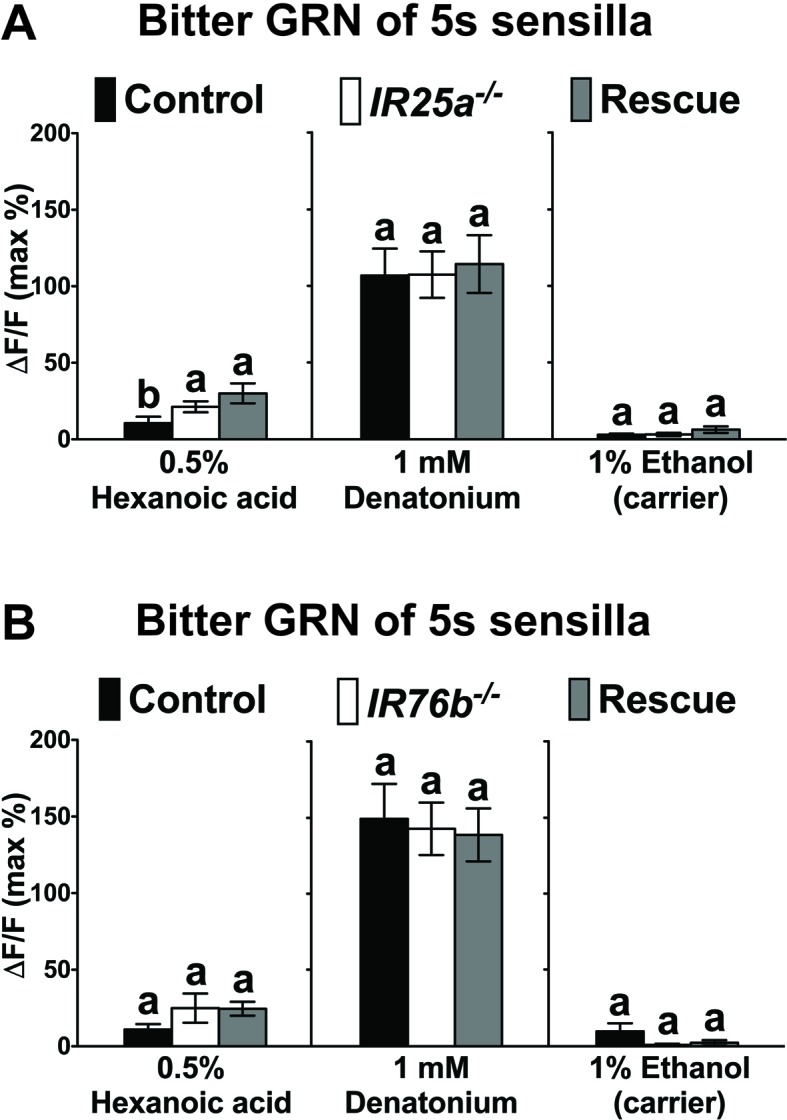
Figure 6—figure supplement 1. Hexanoic acid responses of 5s -associated bitter GRNs of IR25a (A) or IR76b (B) mutant flies.


