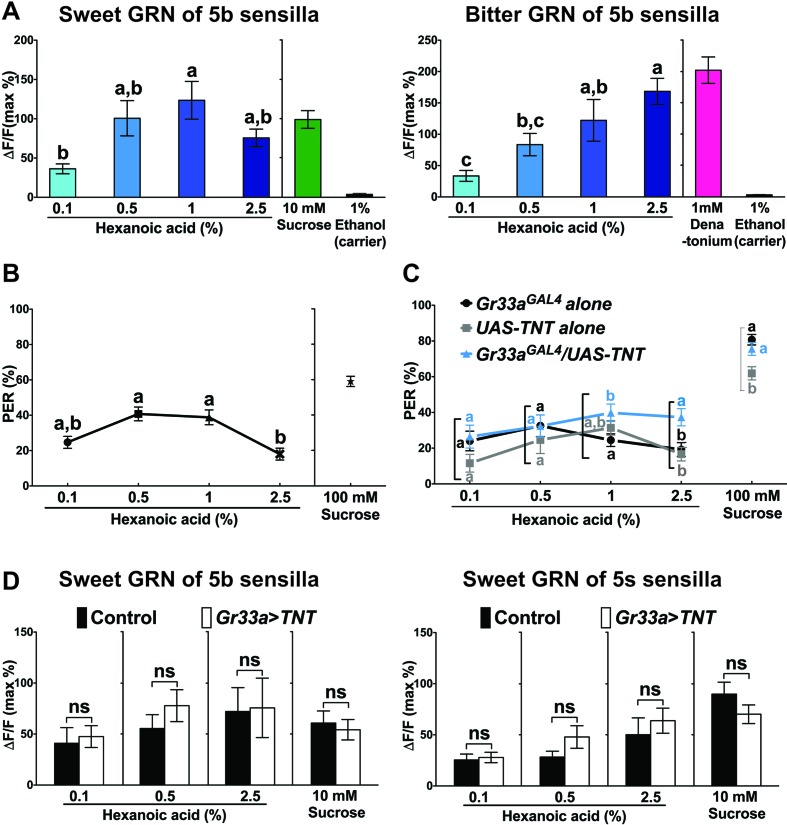
Figure 7. Bitter GRNs inhibit acceptance of high concentration of hexanoic acid.
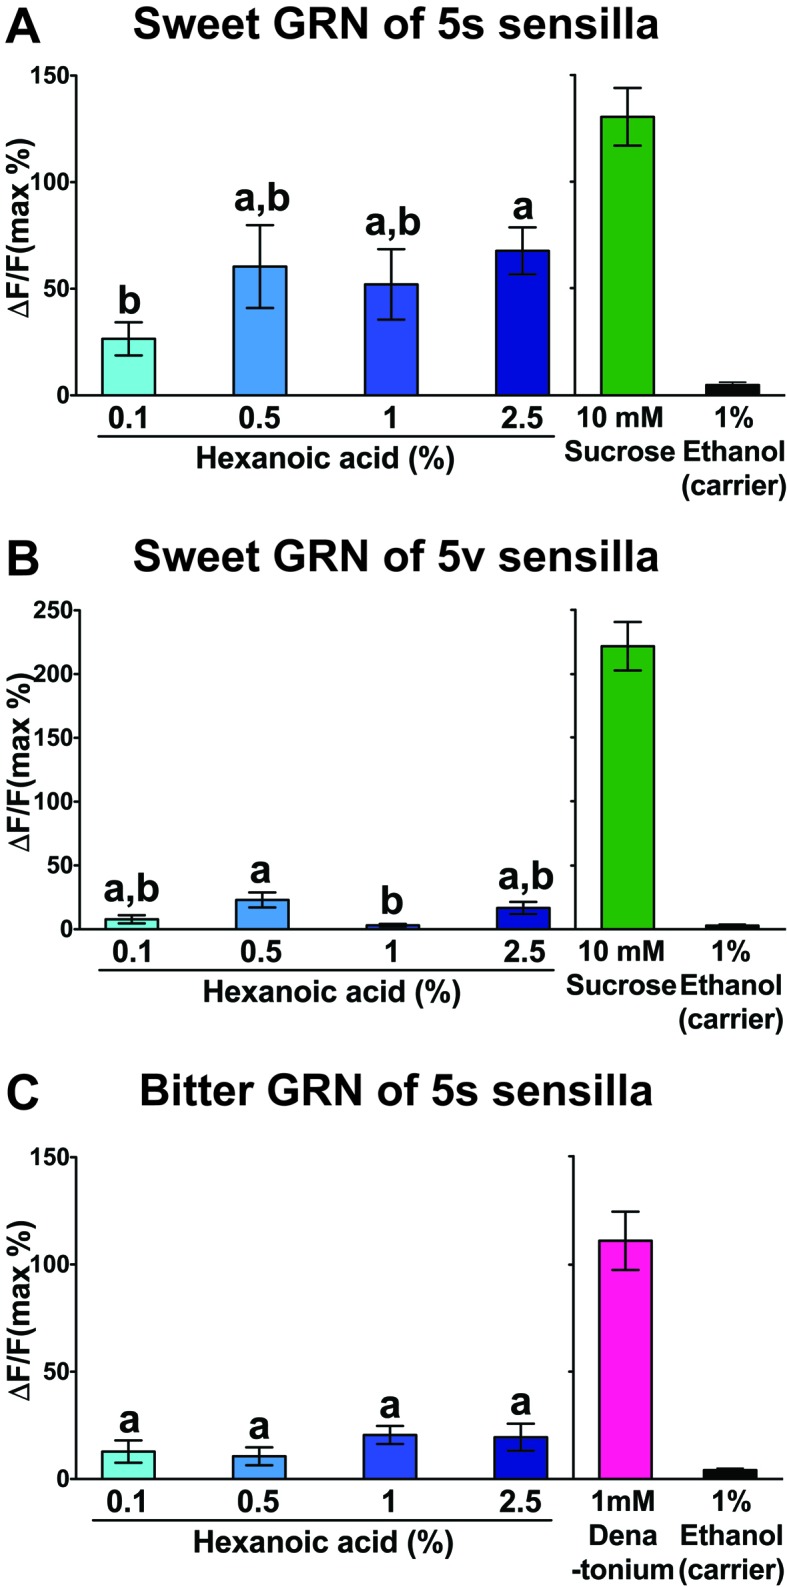
(A) Hexanoic acid dose response profiles of the sweet (left) and the bitter (right) GRNs associated with the 5b sensilla. sweet GRN reaches a maximal response already at 1%, while bitter GRNs responses further increases as ligand concentration increases. Each bar represents the mean ± SEM of Ca2+ imaging with 7–30 female prothoracic legs. Bars with different letters are significantly different (Kruskal-Wallis test by ranks with Dunn’s multiple comparison tests, p<0.05). Each y-axis delineates groups for Kruskal-Wallis test. Fly genotypes: Gr64f-GAL4 UAS-GCaMP6m/+ and Gr33aGAL4/+;UAS-GCaMP6m/+. For hexanoic acid response profiles of the sweet GRNs, or the bitter GRN associated with 5 s/5v sensilla, see Figure 7—figure supplement 1. (B) PER responses of wild-type flies (w1118) to different concentrations of hexanoic acid. At high concentration (2.5%) hexanoic acids induces a much lower PER response compared to more modest concentrations (0.5%–1%). Each symbol represents the mean ± SEM of PER responses (n = 61–142 flies). Symbols with different letters are significantly different (Kruskal-Wallis test by ranks with Dunn’s multiple comparison tests, p<0.01). Each y-axis delineates groups for Kruskal-Wallis test. (C) Inactivation of bitter GRN leads to concentration dependent PER responses to hexanoic acid, while control flies show a response profile similar to w1118 flies (see B). Each symbol represents the mean ± SEM of PER responses (n = 23–121 flies). Symbols with different letters are significantly different (Kruskal-Wallis test by ranks with Dunn’s multiple comparison tests, p<0.05). Each square bracket delineates groups for Kruskal-Wallis test. Fly genotypes: Gr33aGAL4/+ (Gr33aGAL4 alone), UAS-TNT/+ (UAS-TNT alone) and Gr33aGAL4/UAS-TNT. (D) Inactivation of bitter GRNs has no effect on cellular responses of sweet GRNs to hexanoic acid. Ca2+ responses of sweet GRNs to 2.5% hexanoic acid are similar regardless of whether a functional bitter GRN is present. Bitter GRNs was inactivated by expressing UAS-TNT under the control of Gr33aGAL4. Each bar represents the mean ± SEM of 10–15 female GRNs from prothoracic legs. Two-tailed, Mann-Whitney U test between the flies lacking functional bitter GRNs and control flies, p<0.05, ns: not significant. Each y-axis delineates groups for Mann-Whitney U test. Fly genotypes: Gr64fLexA/lexAop-GCaMP6m (control) and Gr33aGAL4/UAS-TNT; Gr64fLexA/lexAop-GCaMP6m (Gr33a > TNT). Source data for summary graphs are provided in Figure 7—source data 1.
Figure 7—figure supplement 1. Hexanoic acid responses of 5s/5v associated sweet (A and B) or bitter (C) GRNs.

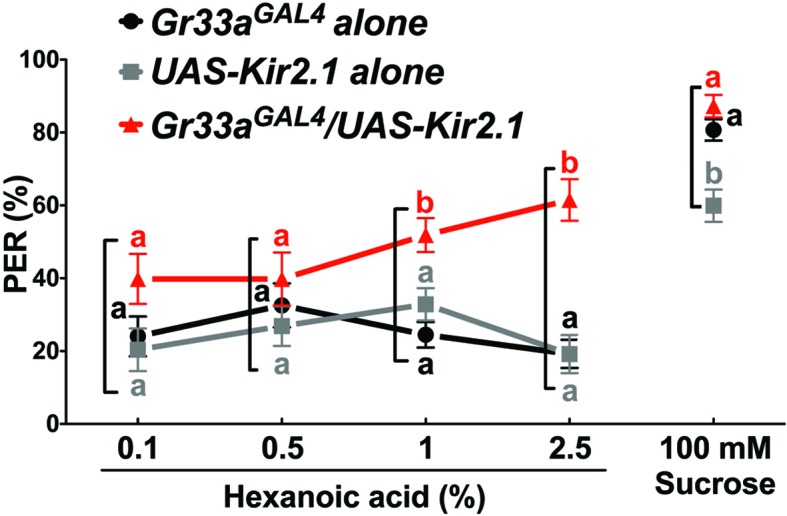
Figure 7—figure supplement 2. Bitter GRNs suppress PER responses to high concentration of hexanoic acid.


