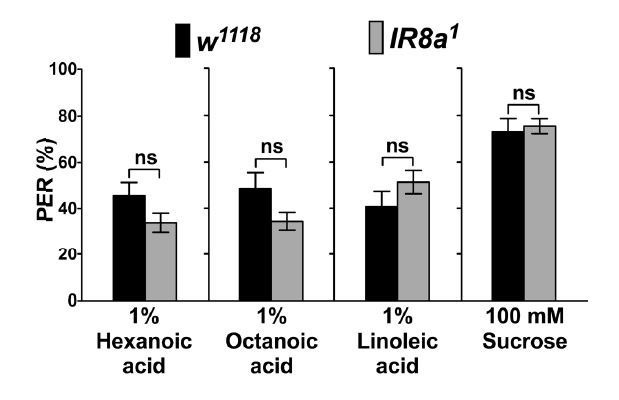
Author response image 1. PER responses of IR8a mutant flies (IR8a1) to fatty acids.

Each bar represents the mean ± SEM of PER responses (n = 35- 55 flies). NS indicates a no significant difference between IR8a mutant and control (w1118) flies (Two-tailed, Mann-Whitney U test, p < 0.05, ns: not significant). Each y-axis delineates groups for Mann-Whitney U test.
