. 2017 Dec 4;6:e26349. doi: 10.7554/eLife.26349

Figure 3. Mapping the peptidergic connectome in the Platynereis larval head.

(A) Positions of cells (nodes) from single cell RNA-Seq from 2-day-old larvae placed in an approximate spatial map, projected on an acetylated tubulin immunostaining (grey, anterior view). Samples with predicted bilateral symmetry were represented as two mirror-image nodes in the map. (B) Expression of neuroendocrine marker genes projected on the single-cell map. Color intensity of nodes reflects magnitude of normalized log10 gene expression. (C) Map of combined expression of 80 proneuropeptides expressed in each single-cell sample. (D) Map of combined expression of 80 proneuropeptides and 23 deorphanized GPCRs expressed in each single-cell sample. (E–L) Connectivity maps of individual neuropeptide-GPCR pairs, colored by weighted in-degree (red) and proneuropeptide log10 normalized expression (blue). Arrows indicate direction of signaling. Arrow thickness determined by geometric mean of log10 normalized proneuropeptide expression of signaling cell and log10 normalized GPCR expression of corresponding receiving cell. (M) Connectivity map of all possible known neuropeptide-GPCR signaling, color and node size represent weighted in-degree. (N) Connectivity map of an IRP2-expressing cell with incoming neuropeptide signals. (O) Connectivity map of an IRP2-expressing cell with outgoing neuropeptide signals.

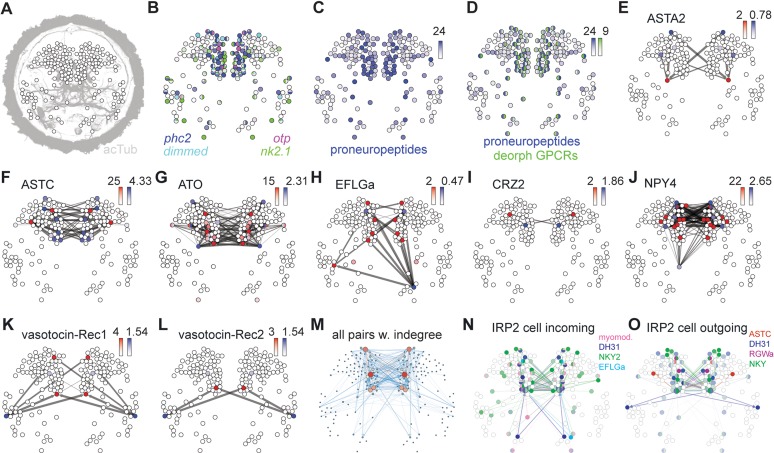
Figure 3—source data 1. Platynereis reference transcriptome version 2.
This transcriptome was generated as described in (Conzelmann et al., 2013a), but with additional paired-end RNA-Seq data from 6 day old Platynereis, sequenced with an Illumina HiSeq 2000 (fasta file).
DOI: 10.7554/eLife.26349.026
Figure 3—source data 2. Normalized transformed read counts for scRNA-seq data from Achim et al. (2015) mapped to our Platynereis reference transcriptome.
Includes spatial prediction from Achim et al. (2015): N = no prediction, Y1 = asymmetric cell predicted, Y2 = bilaterally symmetric pair of cells predicted.
DOI: 10.7554/eLife.26349.027
Figure 3—source data 3. All-against-all pairwise correlation coefficients for normalized transformed read counts of scRNA-seq data from Achim et al. (2015) mapped to our Platynereis reference transcriptome.
This data was used to merge scRNA-seq samples that likely represented the same cell sourced from different larvae (see Materials and methods).
elife-26349-fig3-data3.xlsx (396.5KB, xlsx)
DOI: 10.7554/eLife.26349.028
Figure 3—source data 4. Gexf connectivity map files generated from scRNA-Seq data for each peptide-receptor pair, and for all peptides by all receptors.
DOI: 10.7554/eLife.26349.029

Figure 3.

Figure 3—figure supplement 1. Dose-response curves of Platynereis deorphanized GPCRs treated with varying concentrations of peptides.

Figure 3—figure supplement 1.

Data, representing luminescence units relative to the maximum of the fitted dose-response curves, are shown as mean ±SEM (n = 3). EC50 values and peptide sequences are shown beside each graph.
Figure 3—figure supplement 1—source data 1. Raw data (luminescence measurements) from deorphanization experiments.
DOI: 10.7554/eLife.26349.018
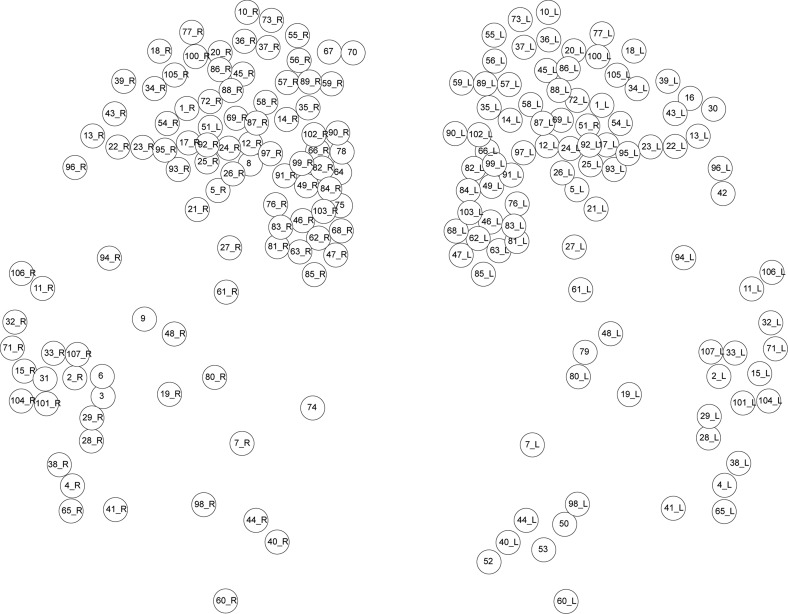
Figure 3—figure supplement 2. Spatial map of single cell RNA-Seq data from (Achim et al., 2015).

Figure 3—figure supplement 2.

The position of each node on the map is an approximation based on the spatial predictions of each RNA-seq sample generated by Achim et al. from comparisons of transcriptome expression with a wholemount in situ hybridization gene expression atlas of 72 genes. The correspondence of node IDs to original sample IDs from Achim et al. (2015) is listed in Supplementary file 1.
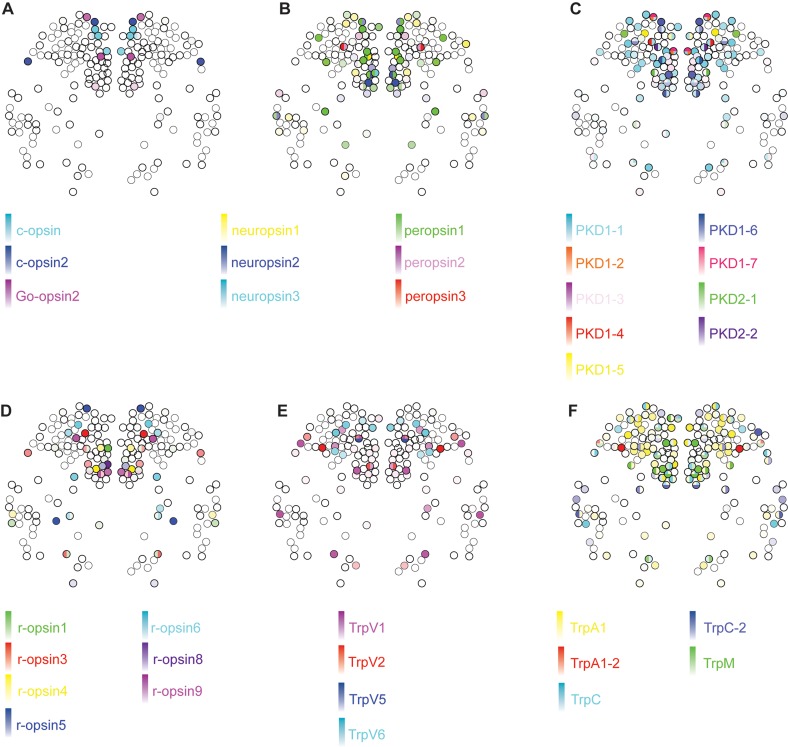
Figure 3—figure supplement 3. Expression of opsins and Trp channels in the Platynereis larval head.

Figure 3—figure supplement 3.

Color intensity reflects relative normalized gene expression levels. Cells of the apical nervous system (i.e., cells expressing any combination of Phc2, dimmed, Otp and nk2.1) are indicated by a bold border.
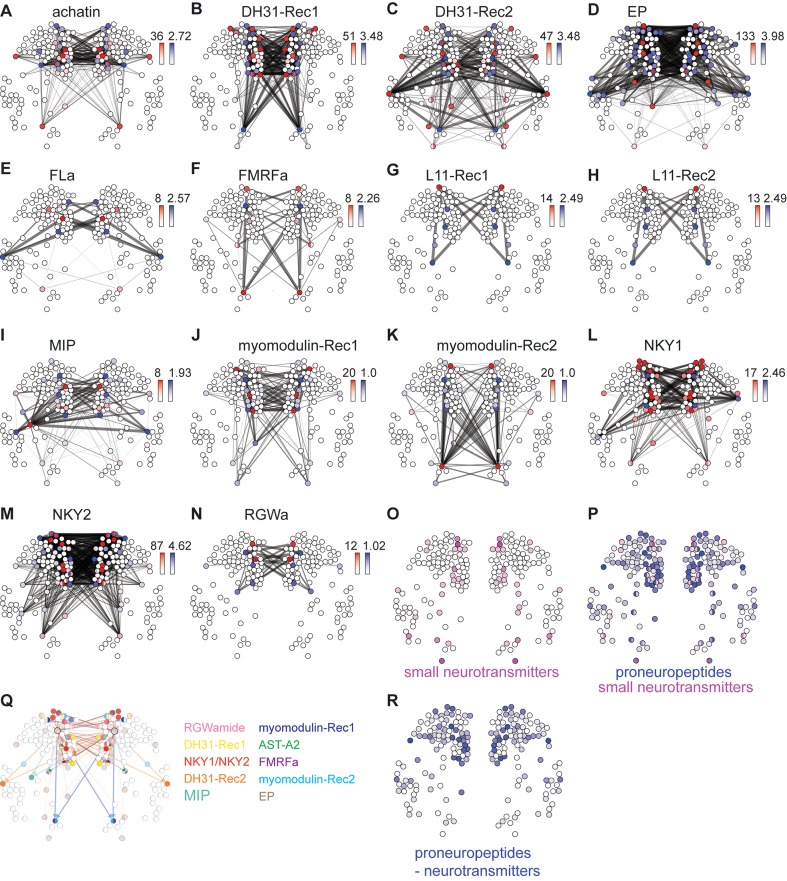
Figure 3—figure supplement 4. Neuropeptide-GPCR chemical connections in the Platynereis larval head.

Figure 3—figure supplement 4.

(A–N) Connectivity maps of individual neuropeptide-GPCR pairs, colored by weighted in-degree (red) and proneuropeptide log10 normalized expression (blue). Arrows indicate direction of signaling. Arrow thickness determined by geometric mean of log10 normalized proneuropeptide expression of signaling cell and log10 normalized GPCR expression of corresponding receiving cell. (O) Expression map of small neurotransmitter synthesis markers. (P) Expression map of proneuropeptides and small neurotransmitter markers. (Q) Multichannel signaling from a highly peptidergic cell. (R) Expression map of proneuropeptides shown for those cells that do not express small neurotransmitter markers.
Figure 3—figure supplement 5. Comparison of spatial distribution of sensory cilia in the anterior head of 48 hpf, 72 hpf and 6 dpf Platynereis.

Figure 3—figure supplement 5.

Cilia and the axonal scaffold of the larvae were labelled by immunostaining with an antibody raised against acetylated tubulin (white). Each sensory cilium is annotated according to its corresponding sensory neuron name in the reconstructed ssTEM data from a 72 hpf larva (yellow). Each staining can also be viewed in a 3D stack in the source data (tiff stacks). Scale bars: 10 µm.
Figure 3—figure supplement 5—source data 1. Tiff stacks of acetylated tubulin immunostaining from a 2-day-old, 3-day-old, and 6-day-old larva, anterior view.
DOI: 10.7554/eLife.26349.023
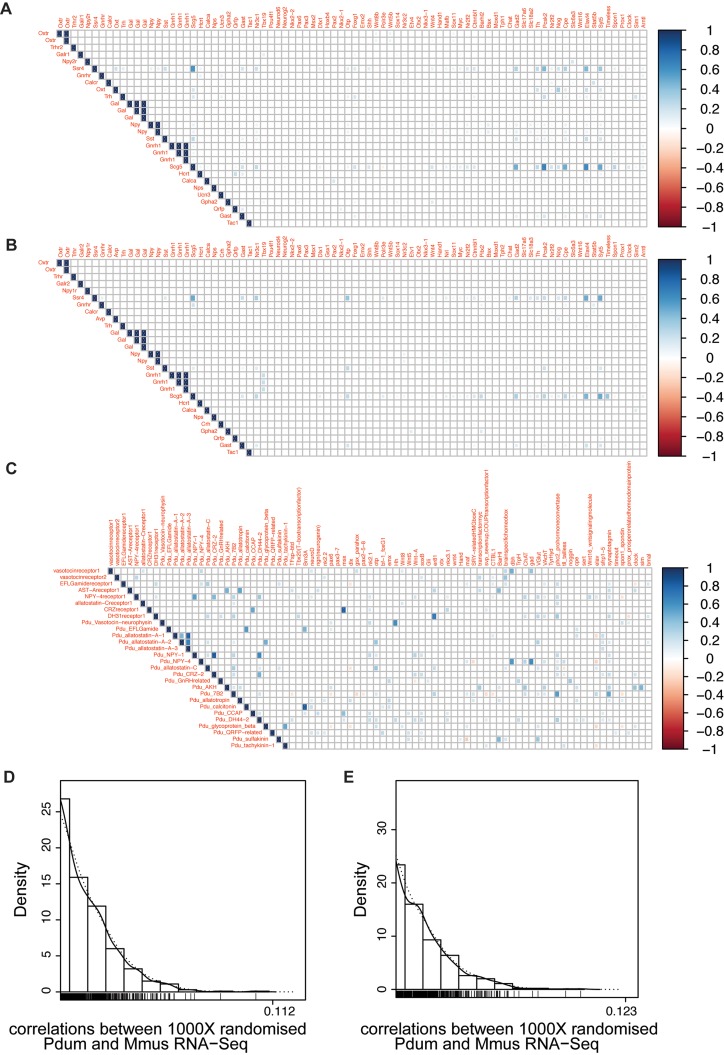
Figure 3—figure supplement 6. Comparison of gene co-expression correlations based on sc-RNA-Seq from Platynereis ANS and mouse hypothalamus datasets.

Figure 3—figure supplement 6.

(A) Co-expression correlation heatmap for mouse data (Romanov et al., 2017 dataset). (B) Co-expression correlation heatmap for mouse data (Campbell et al., 2017 dataset). (C) Co-expression correlation heatmap for Platynereis data. (and E) Distributions of correlations of co-expression values between Platynereis and mouse (Romanov et al., 2017) (D) and Campbell et al. (2017) (E) datasets after 1000X randomization. 0.112 and 0.123 are the global correlation values calculated on, respectively, the Romanov et al., 2017 and the Campbell et al. (2017) datasets, and rank second and first, respectively, compared to all other 1000 correlations computed on the randomized datasets from each of the two datasets.
Figure 3—figure supplement 6—source data 1. List of Platynereis and mouse gene orthologs ‘ortholog_table_pdum_mouse_clean.txt’; Global correlation of Platynereis and mouse orthologous marker gene data sets ‘correlation_pdum_mouse_romanov.txt’, ‘correlation_pdum_mouse_Campbell.txt’; Tables of correlation coefficients and p-values from comparison of Platynereis and mouse scRNA-Seq datasets, Achim et al. (2015) versus Romanov et al. 2016 ‘conserved_coexpression_pdum_Romanov.txt’, Achim et al. (2015) versus Campbell et al. (2017), ‘conserved_coexpression_pdum_campbell.txt’.
DOI: 10.7554/eLife.26349.025