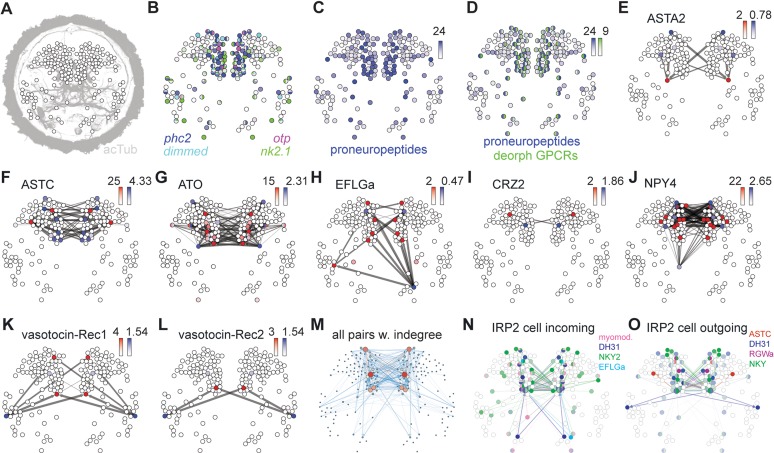
Figure 3. Mapping the peptidergic connectome in the Platynereis larval head.
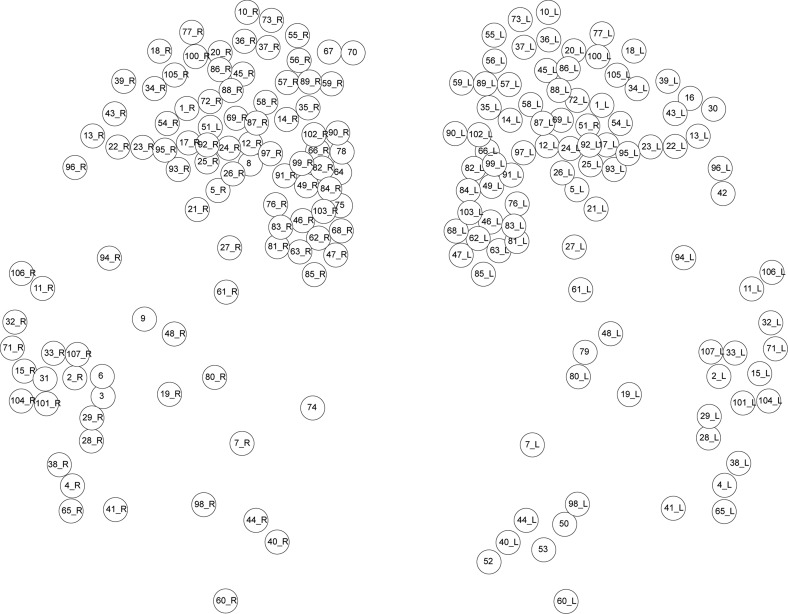
(A) Positions of cells (nodes) from single cell RNA-Seq from 2-day-old larvae placed in an approximate spatial map, projected on an acetylated tubulin immunostaining (grey, anterior view). Samples with predicted bilateral symmetry were represented as two mirror-image nodes in the map. (B) Expression of neuroendocrine marker genes projected on the single-cell map. Color intensity of nodes reflects magnitude of normalized log10 gene expression. (C) Map of combined expression of 80 proneuropeptides expressed in each single-cell sample. (D) Map of combined expression of 80 proneuropeptides and 23 deorphanized GPCRs expressed in each single-cell sample. (E–L) Connectivity maps of individual neuropeptide-GPCR pairs, colored by weighted in-degree (red) and proneuropeptide log10 normalized expression (blue). Arrows indicate direction of signaling. Arrow thickness determined by geometric mean of log10 normalized proneuropeptide expression of signaling cell and log10 normalized GPCR expression of corresponding receiving cell. (M) Connectivity map of all possible known neuropeptide-GPCR signaling, color and node size represent weighted in-degree. (N) Connectivity map of an IRP2-expressing cell with incoming neuropeptide signals. (O) Connectivity map of an IRP2-expressing cell with outgoing neuropeptide signals.

