. 2017 Dec 4;6:e26349. doi: 10.7554/eLife.26349

Figure 4. Projection neurons connect the ANS to the synaptic nervous system.

(A) Connectivity map of all possible known neuropeptide-GPCR signaling, colors represent modules defined by randomized community detection analysis in Gephi and node size represents authority. (B) Reconstructed INRGWaand INNOS projection neurons (ANS) (shades of brown and cyan) in a full body transmission electron microscopy (ssTEM) dataset of a 3-day-old larva, shown against a framework of ANS neurons (light grey). Axons and dendrites appear as lines and cell body positions are represented by spheres. (C) ssTEM reconstruction of INRGWa projection neurons and Ser-h1 serotonergic neurons. Red spheres indicate INRGWa presynaptic sites. (D) ssTEM reconstruction of INRGWa projection neurons and a presynaptic ciliomotor neuron, cMNvl. (E) ssTEM reconstruction of INRGWa neurons and a presynaptic sensory neuron, pygPDbicil. (F) Synaptic connectivity graph of INRGWa, Ser-h1, pygPDbicil, and cMNvl neurons. Synaptic inputs from the synaptic nervous system to the INRGWa neuron are in red. Peptidergic inputs to the INRGWa neurons are indicated with dashed arrows. (G) ssTEM reconstruction of INRGWa projection neurons, Ser-h1 neurons, and the cholinergic ciliomotor MC neuron, anterior view (H) Confocal microscopy image of correlated pixels of GCaMP6s signal in a 2-day-old Platynereis larva after the addition of 25 µM D-achatin neuropeptide, anterior view. Cells showing correlated activity with the serotonergic neurons (red) and the MC cell (cyan) are shown. INRGWa-dcl2 could not be identified in this larva and is likely obscured by the MC cell, Ser-h1l and/or INRGWa-dcl1. (I) Neuronal activity patterns of individually identified neurons in a 2-day-old larva treated with 25 µM achatin.

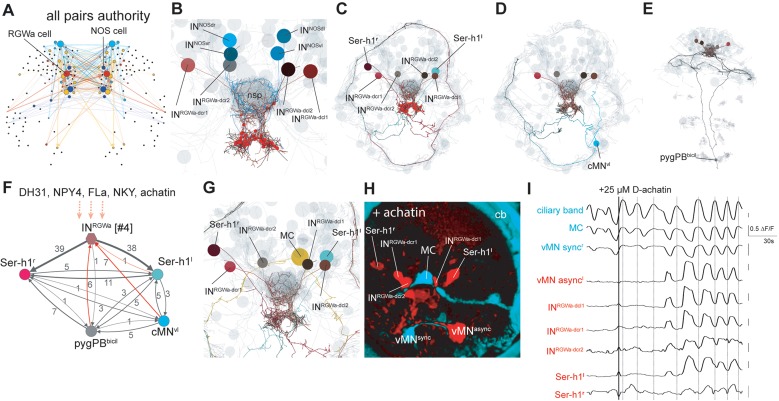
Figure 4—source data 1. Video of calcium imaging in a Platynereis larva used to calculate neuronal activity correlations in Figure 4H and neuronal activity patterns in Figure 4I (.tiff file).
DOI: 10.7554/eLife.26349.034

Figure 4.

Figure 4—figure supplement 1. Spatial distribution of dense core vesicles and synapses in an RGWa-expressing projection interneuron, INRGW-dcr1.

Figure 4—figure supplement 1.

(A) Reconstruction of 50 layers of TEM sections from the 72 hpf larva ssTEM dataset containing the axon of INRGWa-dcr1 in the larval neurosecretory plexus. The axon is coloured light blue, synaptic sites are red, and dense core vesicles purple. Scale bar = 2 µm. This reconstruction can be viewed in 3D in Video 3. (B–E) TEM sections from different z-positions in the 72 hpf larva ssTEM dataset containing the neurites of the INRGWa-dcr1 axon (blue). Examples of dense core vesicles are indicated by purple arrowheads, red arrows indicate synapses (clusters of small clear vesicles at the neurite border). Scale bar A: 2 µm; scale bar B-E: 500 nm.
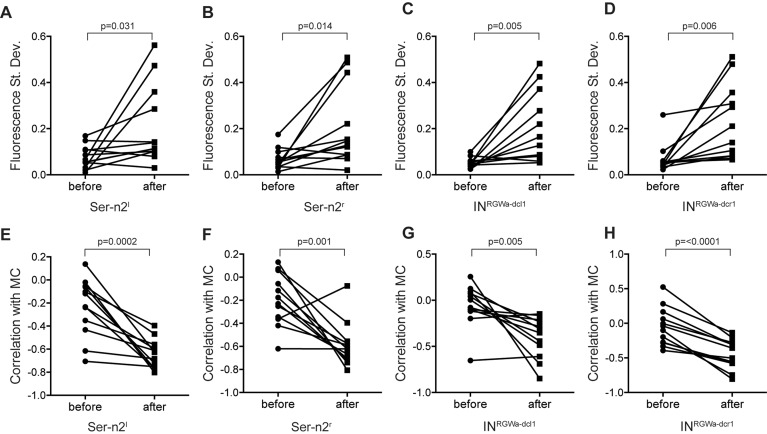
Figure 4—figure supplement 2. (A–D) Standard deviation in fluorescent calcium signal of the (A) Ser-h1l, (B) Ser-h1r, (C) INRGWa-dcl1 and (D) INRGWa-dcr1 neurons in 2-day-old larvae before and after treatment with 25 µM D-achatin.

Figure 4—figure supplement 2.

(E–H) Correlation of neuronal calcium signals of (E) Ser-h1l, (F) Ser-h1r, (G) INRGWa-dcl1 and (H) INRGWa-dcr1 with calcium signals measured from the MC cell in 2-day-old larvae before and after treatment with 25 µM D-achatin.
Figure 4—figure supplement 2—source data 1. Correlation values of neuronal activity patterns and standard deviation of GCaMP6 fluorescence in achatin-treated larvae.
DOI: 10.7554/eLife.26349.033