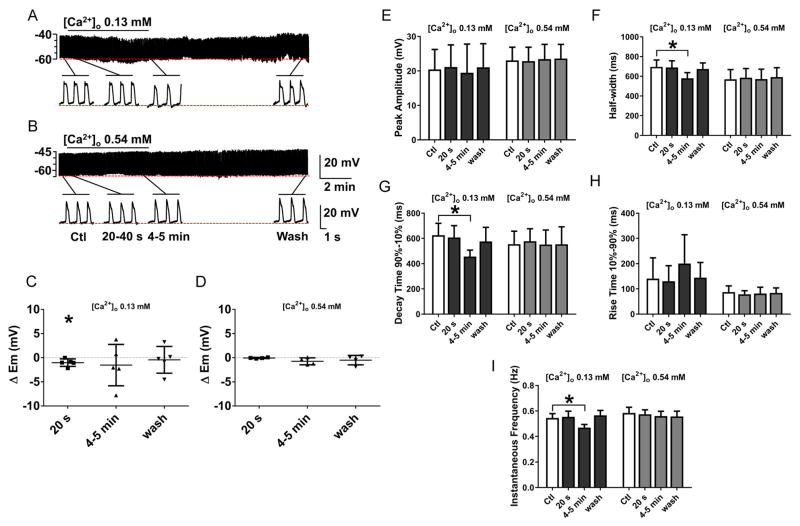
Fig. 6.
The effect on slow wave activity of reducing [Ca2+]o in Krebs to the level of [Ca2+]o obtained by adding gluconate (A) and isethionate (B) (see Fig. 5). Lowering [Ca2+]o did not replicate the effect of replacing [Cl−]o with gluconate or isethionate on electrical activity in mouse jejunal smooth muscle layer. A–B, Representative traces of intracellular recordings upon perfusion with 0.13 mM and 0.54 mM [Ca2+]o. The horizontal bar over each trace indicates the perfusion period of low [Ca2+]o solution. Expanded time scales are shown below the traces. C–I, Summarized data illustrating the effects of reduced [Ca2+]o on slow wave properties: At 0.13 mM [Ca2+]o, (equivalent to the level found in 13.3 mM Cl−, 120.3 mM gluconate Krebs) decreases in the instantaneous frequency (F), shortening of slow wave width (G) and a decrease in the decay times from 90 to 10% of peak amplitude (I) were observed. These effects were reversible on washout. No change was observed in membrane potential (C) and the rest of the slow wave properties (E, H). No effects were observed at 0.54 mM [Ca2+]o (equivalent to 13.3 mM Cl−, 120.3 mM isethionate Krebs; panel D–I). Values are mean ± SEM (N=4–5, *P < 0.05, ANOVA with Bonferroni’s correction for multiple comparisons).

