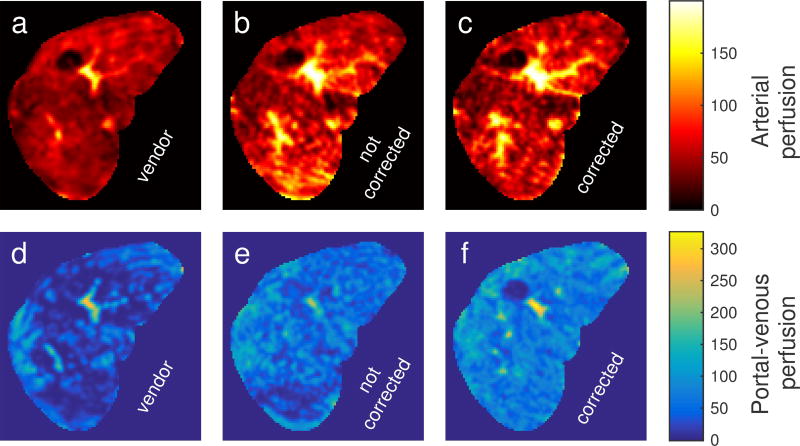
FIG. 7.
Transverse arterial (a–c) and portal-venous (d–f) perfusion maps calculated from DCE-MRI time series reconstructed by vendor software on the scanner without (first column), by a tornado filter without motion correction (second column) and by a tornado filter with motion correction (third column) for a subject. The portal-venous perfusion map in (e) exhibits severe artifacts caused by motion. Perfusion is given in ml/(100 ml · min).

