Fig. 4.

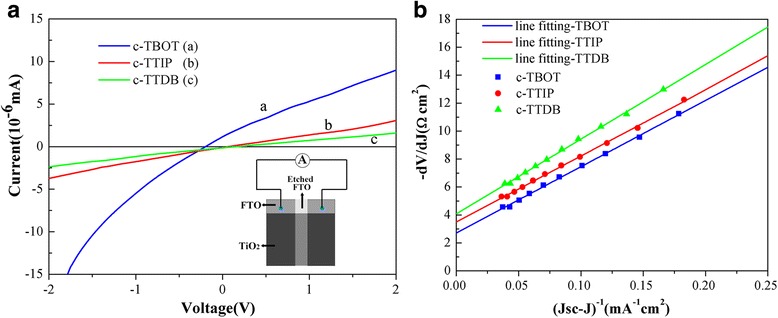
a Conductivity measurement results of various c-TiO2. The inset depicts the structure of the sample. b Plots of − dV/dJ vs (J sc-J)−1 derived from J-V curves and the linear fitting curves

a Conductivity measurement results of various c-TiO2. The inset depicts the structure of the sample. b Plots of − dV/dJ vs (J sc-J)−1 derived from J-V curves and the linear fitting curves