FIGURE 1.
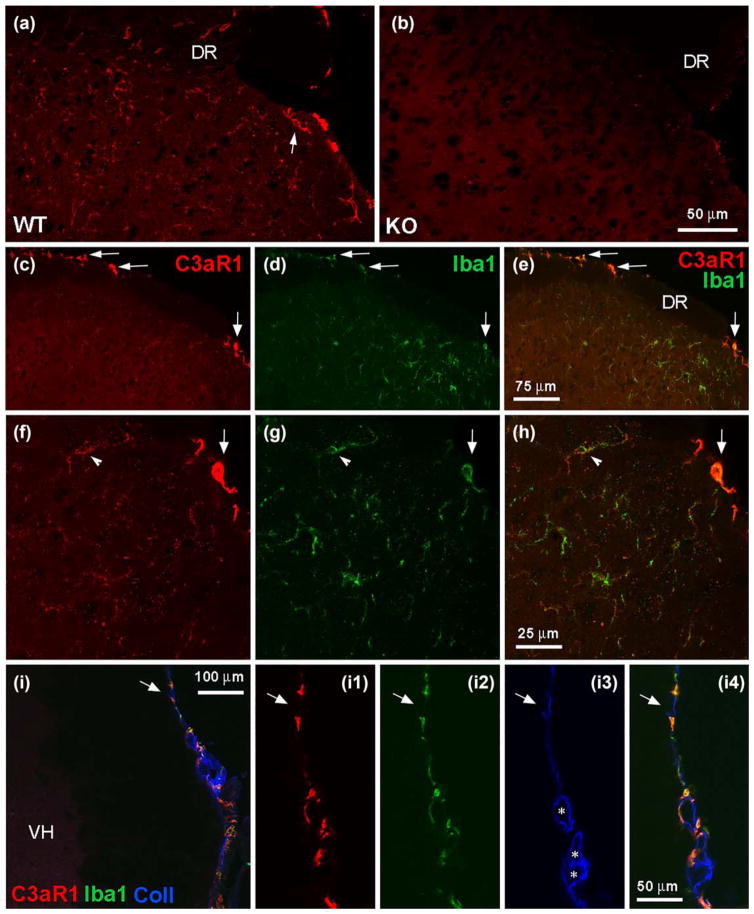
Spinal localization of C3aR1. (a, b) C3aR1 immunolabeling in superficial dorsal horn from wild-type (WT) and knock-out (KO) mice (DR indicates dorsal roots). The arrow in A indicates a cellular profile that is outlined by C3aR1 immunoreactivity (–ir). Scale bar: 50 μm. (c–h) Immuno-histochemical analysis of C3aR1-ir (red) and its relationship to Iba1-ir (green) in dorsal horn. The dorsolateral region of the spinal cord in c–e is shown at higher magnification in f–h; e and h represent digital merging of c, d and f, g, respectively to show colocalization of labeling. C3aR1 and Iba1-ir overlap in fine processes and cellular profiles in superficial dorsal horn (f–h, arrowheads indicate the same cellular profile). Arrows in c–h indicate C3aR1/Iba1-positive profiles at the spinal cord perimeter. The image shown in f–h represents a projection of 3 optical sections, 1 μm apart. Scale bars: c–e, 75 μm; f–h, 25 μm. (i) C3aR1/Iba1-positive profiles at the spinal cord perimeter are associated with collagen IV (Coll) labeling that delineates the pia mater and subarachnoid blood vessels (VH indicates ventral horn; * indicate subarachnoid blood vessels). The spinal cord perimeter is shown at higher magnification in (I1–4). The arrows indicate the same region in I and I1–4. Scale bars: I, 100 μm; I1–4, 50 μm

