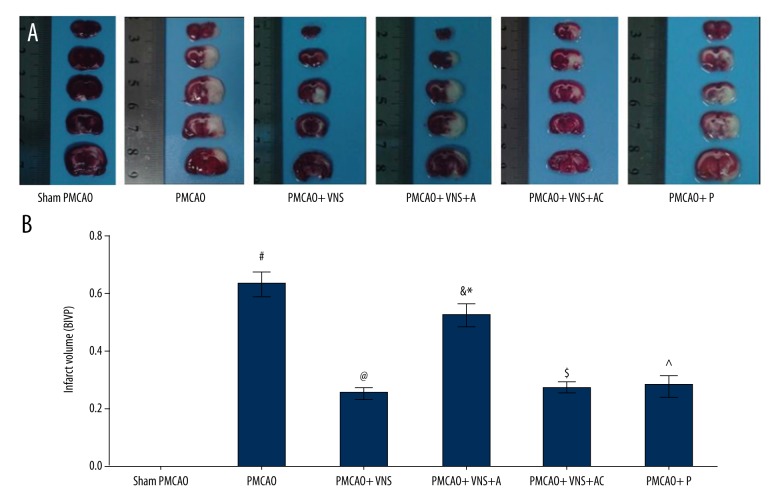
Figure 3.
Cerebral infarct volume was calculated by TTC staining at 24 h following PMCAO. (A) TTC staining in the 6 groups where red area is the healthy tissue and the white area is the infarct tissue. (B) The relative percentage of infarct volume is shown in histograms. All data are expressed as mean ±SD. # p<0.05 versus the sham PMCAO group; & p<0.05 versus the sham PMCAO+VNS group; * p<0.05 versus the sham PMCAO+VNS+AC group; @, ^, $ p<0.05 versus the PMCAO group.

